Hi,
I have a chart for a temperature line using FastLineRenderableSeries and a couple of HorizontalLineAnnotation to show some thresholds for that line.
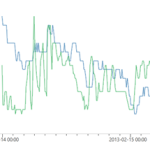
When I call DataSeriesSet.InvalidateParentSurface(RangeMode.ZoomToFit) the chart zoom to fit the data from the data series (which is fine).
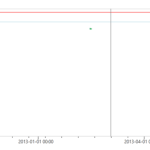
Now I would like to be able to zoom to the chart extents but including those threshold line. What would be the best way to accomplish this?
Screen shots attached.
Chart with RangeMode.ZoomToFit: c1
Chart manually zoomed out to show threshold line: c2
(the chart is that small green dot that is showing just bellow the lower threshold)
The goal is to be able to provide a feature that my users can zoom chart so that both data set and thresholds are shown. I guess a variation of the current zoom to fit but taking into account the annotation lines.
Thanks!
- jsimoes asked 11 years ago
- You must login to post comments
Update: There’s an updated code sample for SciChart v5 here:
- Andrew Burnett-Thompson answered 6 years ago
- last edited 6 years ago
- You must login to post comments
Hi Jose,
Sorry to interrupt Yuriy’s excellent support handling! There is a little known (and not documented) feature which we included to provide users with a workaround in cases like this.
There is a property called SciChartSurface.ViewportManager (expects IViewportManager) which is queried on render to get the X and Y axis VisibleRange.
See below the implementation of DefaultViewportManager:
using System.Diagnostics;

   /// <summary>
    /// The DefaultViewportManager performs a naive calculation for X and Y Axis VisibleRange.
    /// On each render of the parent SciChartSurface, either autorange to fit the data (depending on the Axis.AutoRange property value),
    /// or return the original axis range (no change)
    /// </summary>
    public class DefaultViewportManager : ViewportManagerBase
    {
        /// <summary>
        /// Called when the <see cref="IAxis.VisibleRange"/> changes for an axis. Override in derived types to get a notification of this occurring
        /// </summary>
        /// <param name="axis">The <see cref="IAxis"/>instance</param>
        public override void OnVisibleRangeChanged(IAxis axis)
        {
        }

        /// <summary>
        /// Called when the <see cref="ISciChartSurface" /> is rendered.
        /// </summary>
        /// <param name="sciChartSurface">The SciChartSurface instance</param>
        public override void OnParentSurfaceRendered(ISciChartSurface sciChartSurface)
        {
        }

        /// <summary>
        /// Overridden by derived types, called when the parent <see cref="SciChartSurface" /> requests the XAxis VisibleRange.
        /// The Range returned by this method will be applied to the chart on render
        /// </summary>
        /// <param name="xAxis">The XAxis</param>
        /// <returns>
        /// The new VisibleRange for the XAxis
        /// </returns>
        protected override IRange OnCalculateNewXRange(IAxis xAxis)
        {
            // Calculate the VisibleRange of X Axis, depending on AutoRange property
            if (xAxis.AutoRange)
            {
                var newXRange = xAxis.GetMaximumRange();
                if (newXRange != null && newXRange.IsDefined)
                    return newXRange;
            }

            return xAxis.VisibleRange;
        }

        /// <summary>
        /// Overridden by derived types, called when the parent <see cref="SciChartSurface" /> requests a YAxis VisibleRange.
        /// The Range returned by this method will be applied to the chart on render
        /// </summary>
        /// <param name="yAxis">The YAxis</param>
        /// <param name="renderPassInfo"></param>
        /// <returns>
        /// The new VisibleRange for the YAxis
        /// </returns>
        protected override IRange OnCalculateNewYRange(IAxis yAxis, RenderPassInfo renderPassInfo)
        {
            if (yAxis.AutoRange && renderPassInfo.PointSeries != null && renderPassInfo.RenderableSeries != null)
            {
                var newYRange = yAxis.CalculateYRange(renderPassInfo);
                if (newYRange != null && newYRange.IsDefined)
                {
                    return newYRange;
                }
            }

            return yAxis.VisibleRange;
        }
    }
If you create a class like the above and change the behaviour of OnCalculateNewYRange to return a VisibleRange including your threshold level then you can effectively override the AutoRanging of the chart.
Try this method and let me know how it works
Best regards,
Andrew
- Andrew Burnett-Thompson answered 11 years ago
 Hi Andrew, Yuriy, Appreciate the updates. I'll give it try and let you know if I need any further help. Great support, I agree. :) Thanks!
 My Problem is related: I want to do a special Y Axis zoom where some part of the graph data should be ignored for the zoom (e.g. a large peak that I’m not interested in). I can achieve that with the OnCalculateNewYRange override, but then I can’t “scroll zoom” the y-axis anymore and zooming into a region doesn’t zoom the y axis. How do I do special zoom only if zoom extents is executed ?
 Hi Henning, did you want to do a special zoom on ZoomExtents when user double clicks? If so, then this thread might be of interest https://www.scichart.com/questions/question/zoomextentsmodifier-doesnt-honour-visiblerange. If not (if you require more assistance) I would suggest creating a new forum post with the details and we’ll be glad to help!
- You must login to post comments
Hi,
OK, I could suggest you updating the VisibleRange on corresponding Y axis after InvalidateParentSurface(RangeMode.ZoomToFit) call, something like this:
        void ZoomExtents()
        {
            DataSeriesSet.InvalidateParentSurface(RangeMode.ZoomToFit);

            YVisibleRange.Max = horizontalLineAnnotation.Y1;
            YVisibleRange.GrowBy(0, 0.1);
        }
Does this make sense for you?
Regards,
Yuriy
- Yuriy Zadereckiy answered 11 years ago
- You must login to post comments
Please login first to submit.


