
SciChart for Avalonia XPF v3.0 Released!
SciChart is delighted to announce the release of SciChart XPF v3 — a big step forward for the product. v3 brings […]
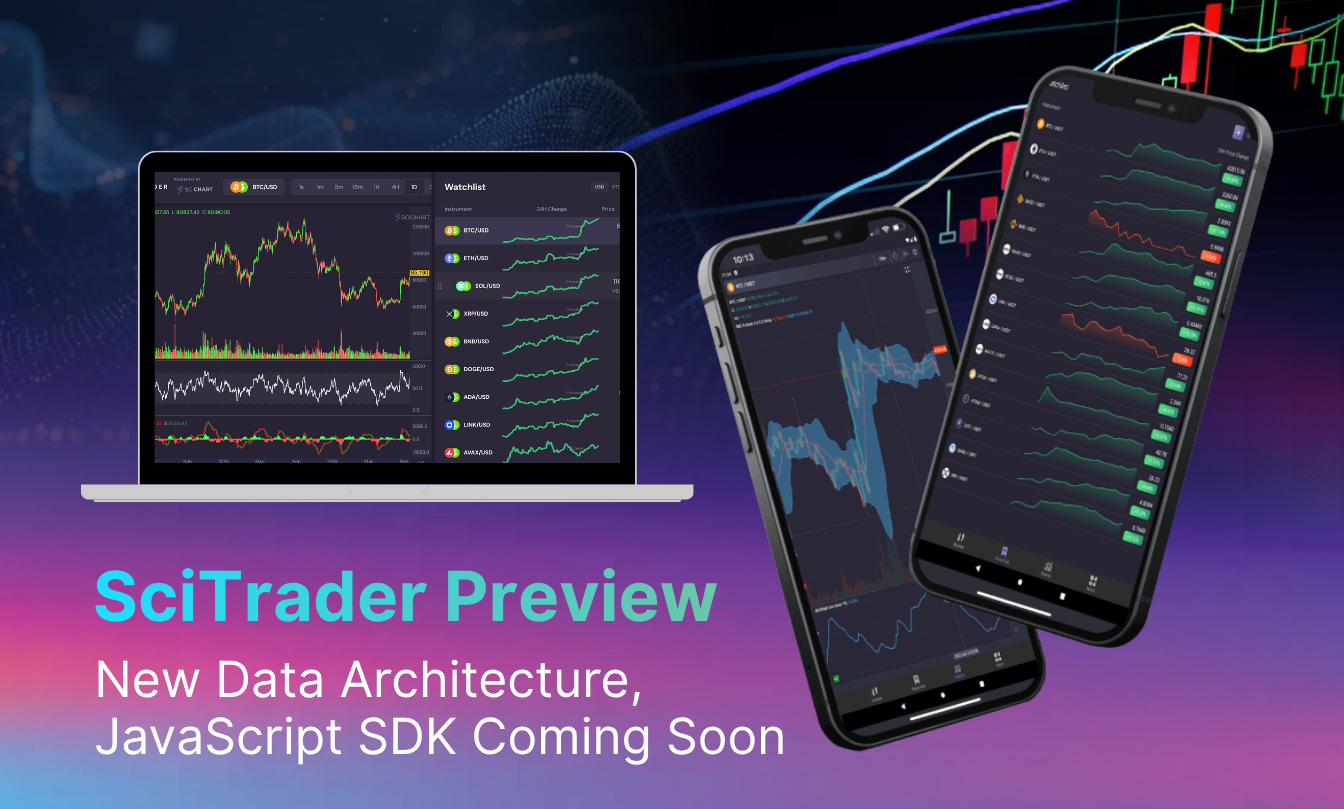
SciTrader is a financial application reference implementation and SDK built on top of SciChart.js, designed to accelerate development of trading, brokerage, exchange, and financial analytics applications.
A public staging deployment is now available, backed by a .NET data server and QuestDB infrastructure. The deployment provides significantly faster loading of historical market data and serves as the current reference implementation for the platform.
Built with QuestDB, the time-series database powering SciTrader’s historical data storage.
Staging Site: SciTrader Staging
A dedicated C#/.NET data server has been implemented to proxy multiple exchanges and manage market data delivery to client applications. The data server:
The data infrastructure now provides generated and stored market data at:
Recent updates introduced server-backed loading of historical market data, enabling rapid retrieval of long-term chart history. Internal testing compared the two approaches: streaming from an exchange over REST + JSON took 20-30 seconds to load just a single year of BTC/USD 1-hour history,
whereas the optimised binary protocol used by the SciTrader DataServer loaded 10 years of the same history in 1-2 seconds.
SciChart already ships native SciTrader SDKs for iOS and Android, both fully open source and requiring a SciChart license to run. A JavaScript and React SDK is now under active development to provide the same reusable trading and market data functionality on the web. Current components include:
The SDK is built around a single root object, SciFinanceChart, created with .create() or .createWithStudies(). Passing in a set of predefined studies (for example candlesticks, volume, RSI and MACD) and an exchange is enough to produce a fully configured, multi-pane trading chart, no manual wiring of data, panes or indicators required.
Financial drawing tools continue to be integrated into the platform, including channels, Fibonacci retracements, pitchforks, fans, trend lines, and take-profit/stop-loss markers. Drawings persist across timeframe changes, with supporting demonstrations already available in the SciChart JavaScript ecosystem.
For now, the fastest way to evaluate SciTrader is to contact us for a demo.
The iOS and Android SDKs continue to receive updates, with more planned. Current work is focused on unifying all three SDKs, iOS, Android, and JavaScript/React, around a similar feature set and shared documentation, then re-releasing the iOS and Android applications on top of the new SciTrader data server described above.
The current SciTrader application demonstrates how the SDK can be used to build a complete trading experience.
Watchlists: Users can monitor multiple instruments simultaneously, including rapidly updating cryptocurrency markets.
Instrument Search and Lookup: Applications can search and switch between supported instruments and exchanges.
Timeframe Switching: Users can switch between multiple chart intervals supported by the data infrastructure.
Technical Indicators: Applications can add, remove and configure indicators within the trading environment.
Interactive Charting: Support includes zooming, panning, chart interaction and financial analysis workflows.
Financial Drawing Tools: Users can place and manage trading-oriented drawing tools directly on charts, including channels, Fibonacci retracements, pitchforks, fans, trend lines, and take-profit/stop-loss markers, with drawings persisting across timeframe changes.
Performance Demonstrations:
Recent demonstrations showcased:
The following areas were explicitly identified as ongoing work:
Current references mention:
with the SDK intended to remain framework agnostic for use across JavaScript ecosystems.
Current Status: Active development preview release. The architecture and application you can try on staging are real and working; documentation, packaging, load testing, security hardening and additional functionality remain in progress. We’d love your feedback: try the staging environment and let us know what’s working, what’s missing, and what you’d want to build with it.
Related Posts

Queen’s Award for Innovation
Winners of the Queen’s Award for Innovation, recognising SciChart’s high-performance graphics engine.

National Business Awards
Highly Commended at the Lloyds National Business Awards for innovation and customer growth.

National Technology Awards
Awarded Healthcare Tech of the Year at the 2025 National Technology Awards.

Reviews
Hundreds of verified third-party reviews from developers, engineers, and customers worldwide.