SciChart.js v6 in Alpha – WebGPU, Incredible Performance Gains and more
Our team has been working hard on continued R&D with SciChart.js – High Performance JavaScript Charts – and today we’d […]
SciChart.js, our Ultra-High Performance JavaScript Chart library is now released!
“With WebAssembly and WebGL hardware acceleration and an optimized render pipeline, SciChart provides extremely fast JavaScript charts capable of drawing millions of data-points in realtime …” [read more]
Just a quick update on our progress on SciChart.js – a Fast Realtime JavaScript Chart component.
Earlier in the year we published that we were working on a JavaScript chart library. Our aim is to port our Award Winning, Best-in-class Windows and Mobile Chart library to JavaScript, but because we wanted to achieve the best performance in the world, we’re focused on using cutting-edge technologies WebGL2 and WebAssembly.
Our work is progressing very well! This week we began the work of writing documentation, tutorials and an examples application to showcase SciChart.js, which means we’re quite close to a BETA release!
This is just a preview, we’ve not gone to BETA yet, but we wanted to show you how the SciChart API is shaping up.
First of all, the SciChart.js API will be very similar to the SciChart family across platforms that we support: Windows (WPF), iOS, Android and Mac OSX.
You will declare a SciChartSurface, then add X & Y Axis to the chart. SciChart.js will support unlimited, multiple X,Y Axis of different types. In the first release we will support NumericAxis, Date Axis, Category Axis for stock charts out of the box. In future releases we can add Logarithmic Axis, Discontinuous Axis and more, but for now the above is enough to create rich JavaScript charting applications with SciChart.
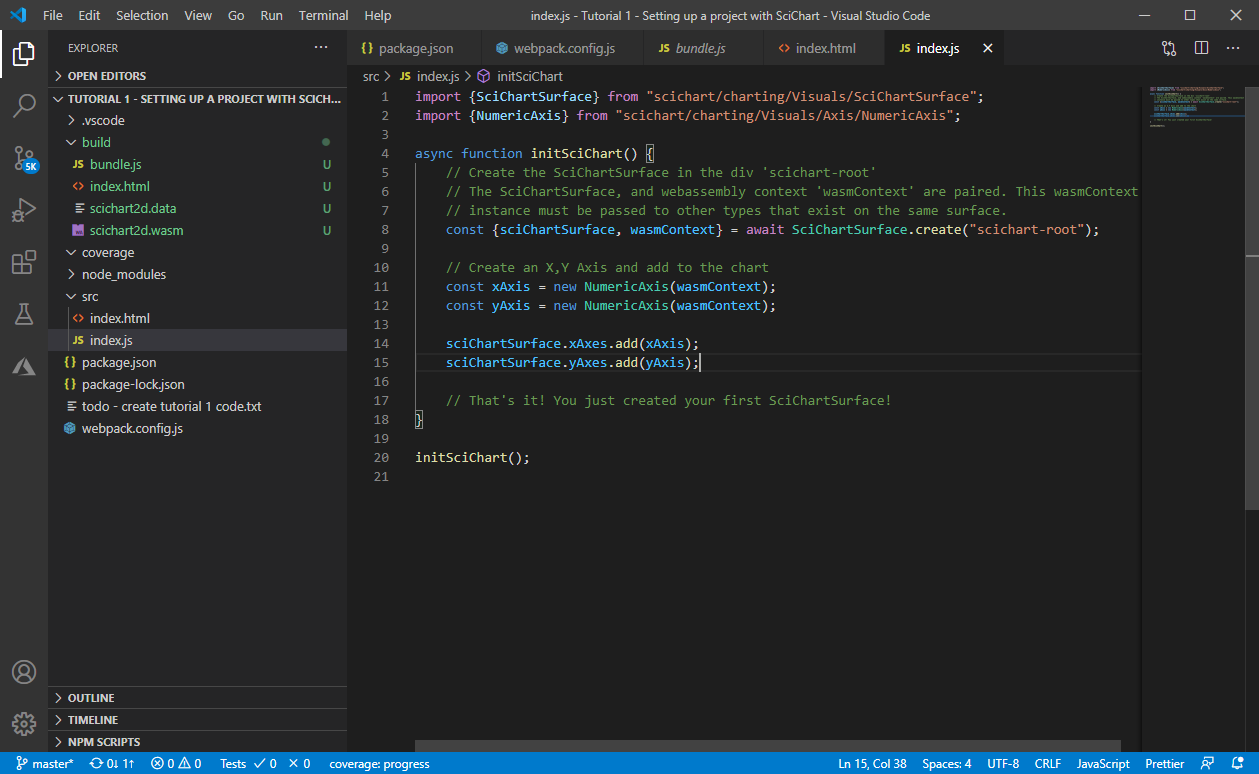
// Creating a SciChartSurface with single X,Y Axis
const {sciChartSurface, wasmContext} = await SciChartSurface.create("scichart-root");

// Create an X,Y Axis and add to the chart
const xAxis = new NumericAxis(wasmContext);
const yAxis = new NumericAxis(wasmContext);

sciChartSurface.xAxes.add(xAxis);
sciChartSurface.yAxes.add(yAxis); To add series or chart-types to the chart, you must declare a RenderableSeries and a DataSeries. For example, a line series is represented by FastLineRenderableSeries and this requires data in an XY format, using XyDataSeries. We’ve done this to separate out render (view) from data and also simplify real-time data updates, which is SciChart’s speciality.
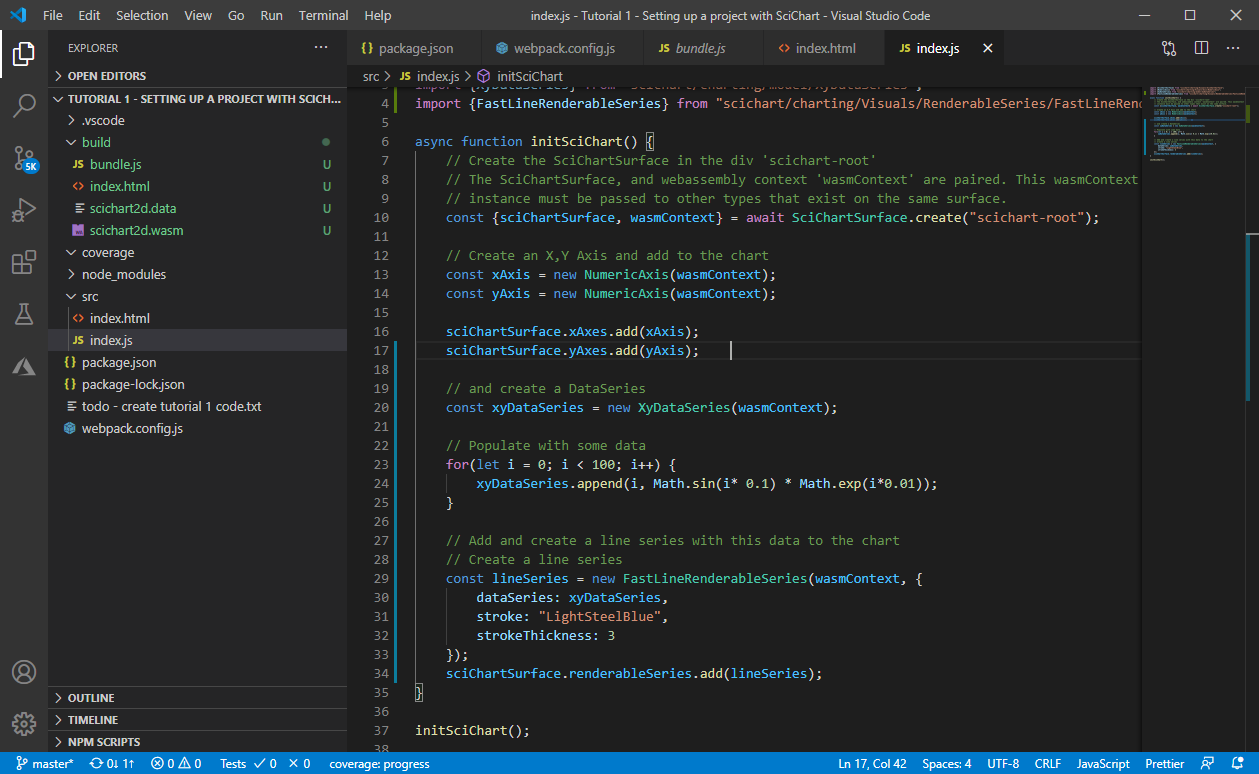
// To add a line series to the chart, create a DataSeries
const xyDataSeries = new XyDataSeries(wasmContext);

// Populate with some data. SciChart can render millions of data-points!
for(let i = 0; i < 100; i++) {
    xyDataSeries.append(i, Math.sin(i* 0.1) * Math.exp(i*0.01));
}

// Add and create a line series with this data to the chart
// Create a line series
const lineSeries = new FastLineRenderableSeries(wasmContext, {
    dataSeries: xyDataSeries,
    stroke: "LightSteelBlue",
    strokeThickness: 3
});
sciChartSurface.renderableSeries.add(lineSeries);
This results in something like the following JavaScript Chart:
SciChart’s speciality is Big-data, real-time charts for scientific, medical and financial applications. To give you an idea of just how powerful the SciChart’s JavaScript charts will be, let’s make our example a little bit harder by adding 100 series, each with 10,000 data-points.
// Create the SciChartSurface in the div 'scichart-root'
const {sciChartSurface, wasmContext} = await SciChartSurface.create("scichart-root");

// Create an X,Y Axis and add to the chart
const xAxis = new NumericAxis(wasmContext);
const yAxis = new NumericAxis(wasmContext);

sciChartSurface.xAxes.add(xAxis);
sciChartSurface.yAxes.add(yAxis);

// Create 100 dataseries, each with 10k points
for (let seriesCount = 0; seriesCount < 100; seriesCount++) {
    const xyDataSeries = new XyDataSeries(wasmContext);

    const opacity = (1 - ((seriesCount / 120))).toFixed(2);

    // Populate with some data
    for(let i = 0; i < 10000; i++) {
        xyDataSeries.append(i, Math.sin(i* 0.01) * Math.exp(i*(0.00001*(seriesCount+1))));
    }

    // Add and create a line series with this data to the chart
    // Create a line series
    const lineSeries = new FastLineRenderableSeries(wasmContext, {
        dataSeries: xyDataSeries,
        stroke: `rgba(176,196,222,${opacity})`,
        strokeThickness:2
    });
    sciChartSurface.renderableSeries.add(lineSeries);
}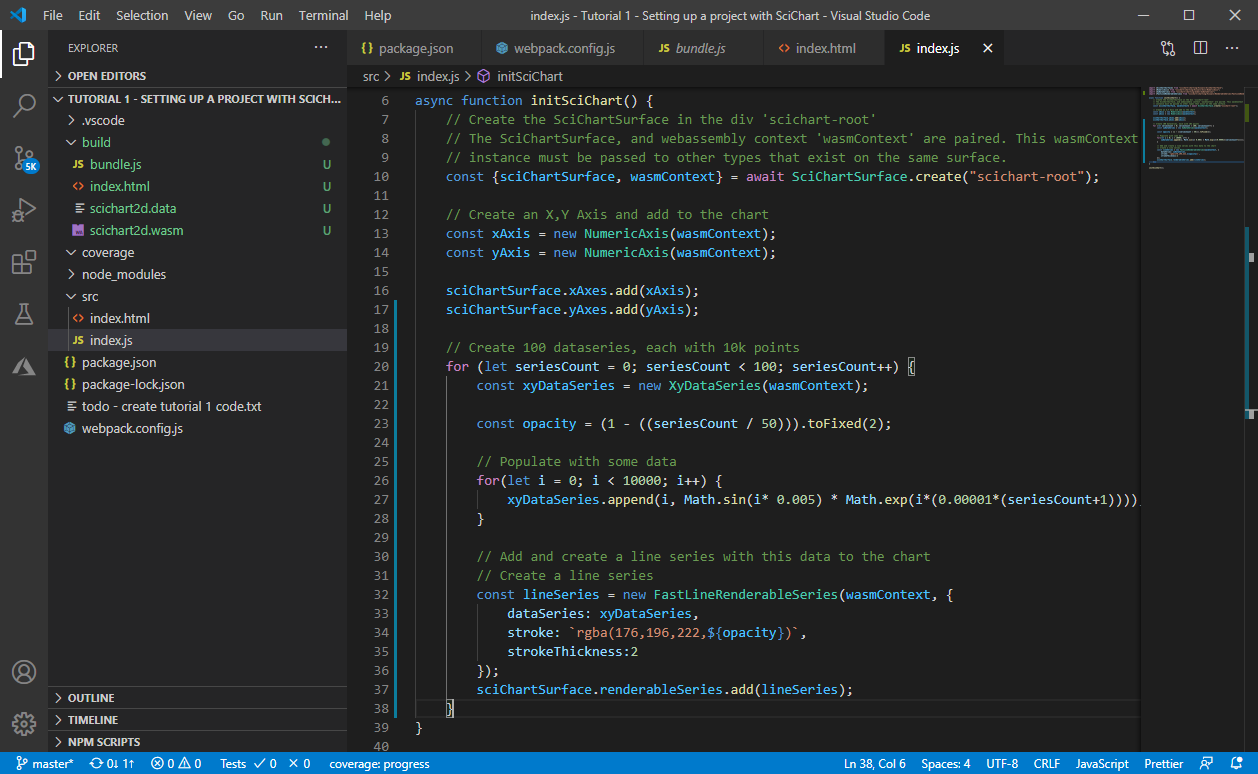
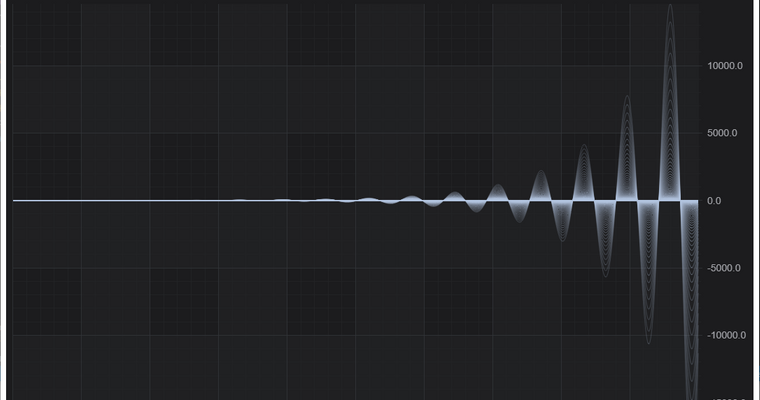
This results in a cool, ghostly waveform like this with 100 series, 10,000 data-points per series (1 Million data-points total).
SciChart.js is going to ship with multiple zooming and panning behaviours out of the box. To add zoom, pan behaviours is really easy. You just need to add one of our pre-packaged modifiers to the chart.
// Add zoom, pan behaviours to the chart. Mousewheel zoom, panning and double-click to
// zoom to fit
sciChartSurface.chartModifiers.add(new MouseWheelZoomModifier(wasmContext))
sciChartSurface.chartModifiers.add(new ZoomPanModifier(wasmContext))
sciChartSurface.chartModifiers.add(new ZoomExtentsModifier(wasmContext))
With a few extra lines of code, you can add zooming and panning behaviour, and now your chart looks and interacts like this:
Before the release We’ll be adding more features and creating our examples application, documentation, tutorials and more. Expect to see from version 1 of SciChart.js the following features:
SciChart.js – our GPU Accelerated 2D/3D JavaScript Chart has now been released! In fact, we have just released a version 2 (November 2021) which is a Huge upgrade to v1.
If you want to learn more about SciChart.js or start a trial, or test drive the features by looking at our Js Charts Demo, click the link below.
SciChart.js JavaScript Chart Library
SciChart provides high performance real–time chart components on the WPF (Windows), iOS, Android and Xamarin platforms. It is our goal to create the best cross-platform Native WPF, iOS, Android and JavaScript 2D & 3D Charts in the world, focusing on performance, developer productivity, ease of use, depth of features and enterprise-grade tech support.
If you have a question about what SciChart’s WebGL / WebAssembly JavaScript Charts can offer you, or if you would like to get a quote, please contact us. Our friendly, helpful support team will be glad to help!
Recent Blogs
![]()
Queens Award for Innovation
Proud winners of the Queens Award for Innovation, 2019. Awarded on account of our innovative graphics engine which underpins the SciChart library and enables our world-beating charting performance
![]()
National Business Awards
Highly Commended for Lloyds National Business Awards, 2019. Awarded on account of our innovative graphics engine and impressive customer base
![]()
National Technology Awards
Awarded “Healthcare Tech of the Year” at the 2025 National Technology Awards – a top UK recognition for breakthrough innovation in technology.

Reviews
SciChart has received hundreds of verified, 3rd party reviews