Fastest Chart Libraries for Quantitative Analysis & Quant Finance
Evaluate the fastest chart libraries for quantitative analysis to maintain stable, high-performance visual dashboards in volatile financial markets.
Whether you’re building a retail trading platform or a complex institutional terminal, the trading charting library you choose determines how market data is rendered and acted upon by traders.
As high-frequency data feeds, larger historical data ranges, and AI-driven analysis become the baseline, developers face a decision: rely on a trading chart widget built for standard use cases or adopt a high-performance charting SDK. The right SDK can support larger datasets, full customization, cross-platform deployment, and the ability to build differentiated trading interfaces beyond standalone charts – without the per-user pricing constraints of closed solutions.
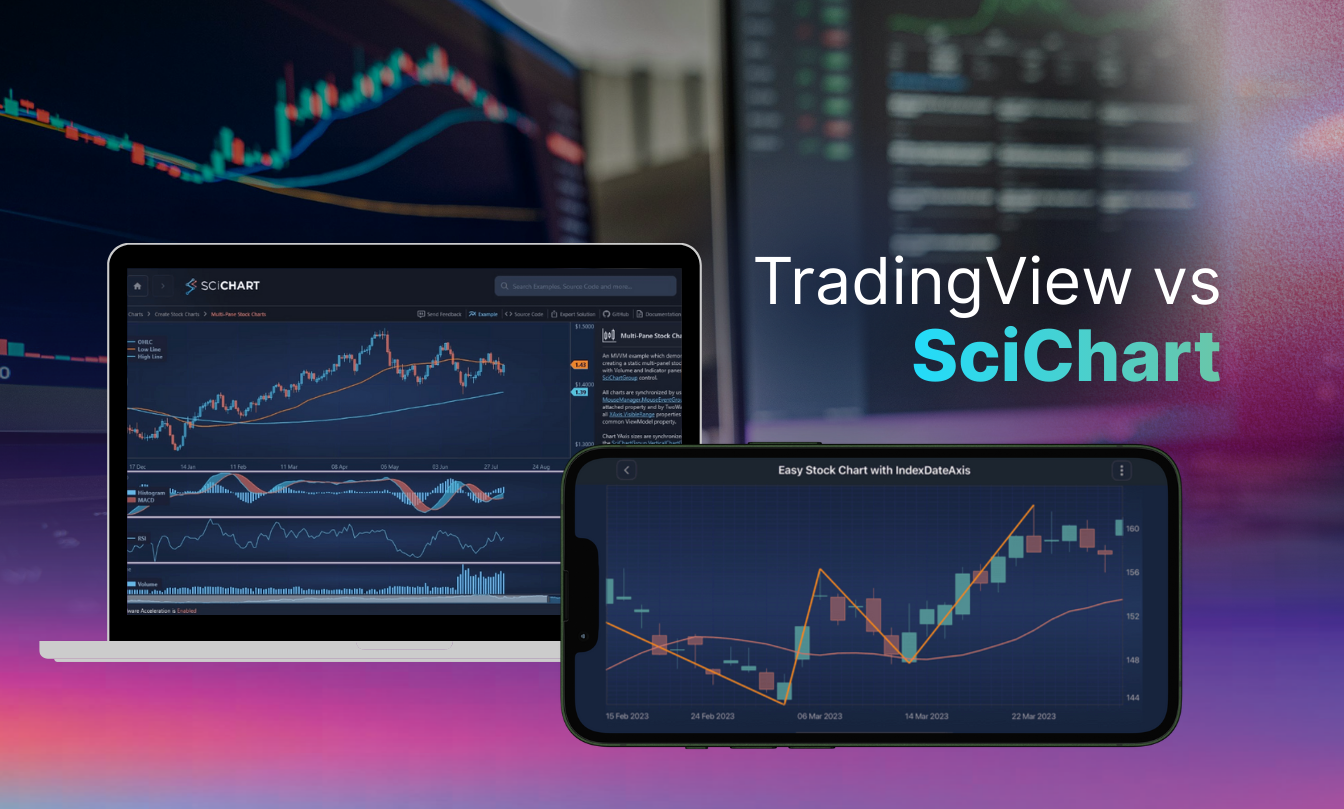
This guide compares SciChart as a TradingView alternative that balances large datasets and unparalleled customizations with true brand ownership.
Selecting a charting tool is one of those decisions that can either accelerate your roadmap or anchor it in technical debt. For developers in the fintech or crypto space, the stakes are remarkably high. You often start by looking for something that just works out of the box, but you quickly realize that most libraries struggle with real-time data density. In practice, performance bottlenecks are about how charts respond to continuous user interactions, custom modifiers, overlays, annotations, and real-time updates without UI lag.
If your application needs to display live market movements, you may encounter limitations on how wide a data range you can display. For instance, you can only view around 4000 candles on a chart with TradingView. So, the real limit is how much data you can view.
If you’re analyzing 1-minute candles, the maximum data range you can have in a TradingView chart is around 3-days of data. Whereas, for SciChart, we can handle over 10 million candles, enough to render the 20-year history of Bitcoin as a 1-minute chart.
The primary risk is not being able to view enough data. During a market spike, a chart that doesn’t show the full picture can erode user trust. Many teams also fall into the trap of choosing a library that seems affordable initially but scales aggressively in price as your user base grows.
Beyond the code, there is the risk of stagnation. If you rely on an open-source tool or a rigid widget, you might find yourself waiting months for a critical bug fix or a missing feature. This lack of enterprise-grade support often forces developers to build hacky workarounds that are difficult to maintain.
TradingView is a household name for fintech charting platforms for traders, but for developers building bespoke apps, it functions more as a widget than a true development kit. It’s essentially a finished product you embed, which limits how much you can truly own the user experience.
While TradingView provides iFrames that are easy to drop in, they often come with unavoidable watermarks and rigid layouts. Their product lives inside your app. This inevitably leads to visual and interaction sameness across the market, making it difficult for products to stand out. Choosing a widget means your app looks and behaves like every other TradingView-based product. Choosing an SDK enables a differentiated trading experience that becomes part of your competitive advantage
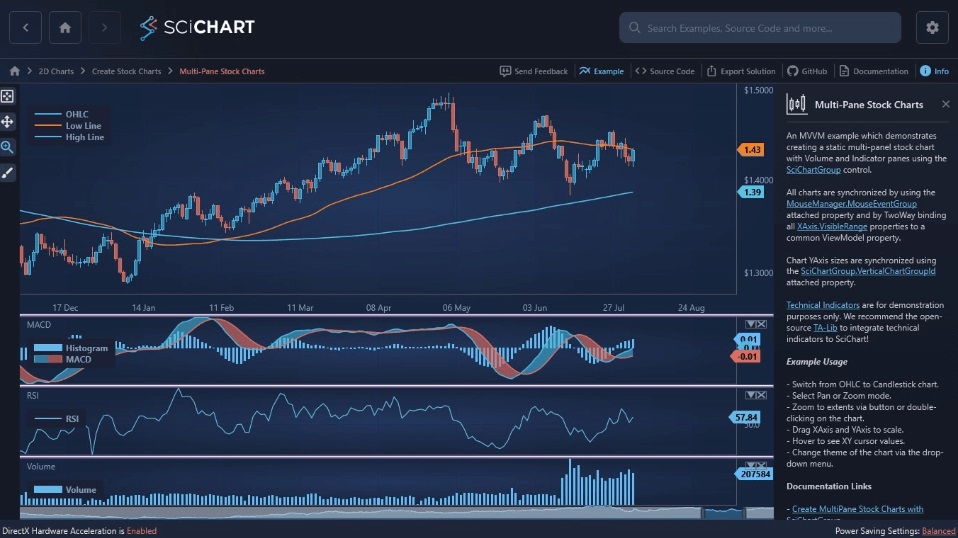
SciChart is a deep-level SDK built from the ground up. Its specific financial and trading offering, SciTrader, is an open-source library which adds TradingView-like charts with indicator panes, zooming, panning and touch interactions. Timeframe changes can also accelerate your financial application development. Just clone the repository and add it as a git submodule and you can customize it to your liking.
SciChart allows you to build completely white-labeled solutions where every axis, annotation, and interaction is under your control. This gives you the blueprint to build whatever you want.
| Feature | SciChart | TradingView (Widgets/Library) |
| Primary Engine | Visual Xccelerator™ (C++ / WebAssembly) | HTML5 Canvas |
| Data Performance | Over 100 million data points without lag | Limited to ~4,000 candles or bars |
| Platform Support | JavaScript, WPF, iOS, Android (Native) | Mostly Web-based (Wrappers for Mobile) |
| Branding | 100% White-labeled | Mandatory Watermarks (unless high-tier) |
| Licensing Model | Per developer licensing for up to 15,000 users with fair and low-cost runtime fees for commercial trading apps. Free community edition for non-commercial projects. | Per-user / MAU-based enterprise licensing (Can be very expensive at scale) |
| Customization | Unlimited API access to all elements | Limited to preset themes and styles |
| Technical Support | Enterprise-grade with AI assistant | Community-focused or high-tier enterprise only |
Yes — SciChart is significantly cheaper than TradingView at scale because it uses a per-developer licensing model instead of per-user pricing.
When people search for a ‘free alternative to TradingView’, cost is usually at the top of the list. TradingView’s commercial licensing often operates on a per-user basis, which can quickly balloon into millions of dollars for popular apps. They offer free versions, but these typically feature their branding.
SciChart serves as a cheaper alternative to TradingView. To start, you pay for the number of developers using the library. We only charge a per-user fee for commercial financial apps with more than 15,000 users. These fees are typically low and predictable, so there won’t be unexpected surprises. For any application with a substantial user base, your choice of chart library can save significant capital while removing all third-party branding.
You can access SciChart for free with a watermark, but this is not suitable for commercial use. However, for commercial use and watermark-free charts, SciChart is still a more affordable alternative to TradingView.

SciChart is a TradingView alternative that offers full SDK-level customization, whereas TradingView functions primarily as an embedded widget with limited UI and interaction control.
Customization is where the divide between a widget and an SDK becomes most apparent.
TradingView allows you to change colors and toggle some features, but you are largely stuck within their UI paradigm. If you need a non-standard chart type or a specific interaction logic, you might hit a wall. While it comes with many features out of the box, such as technical indicators, drawing tools, even data feeds in the paid version, it’s difficult to customize and whitelabel into your apps. Users are going to know its TradingView, and true customization and whitelabelling is difficult or expensive.
Beyond branding, using the same embedded solution as the rest of the market limits your ability to introduce genuinely new interaction models or differentiated trading experiences.
If you need an alternative to TradingView that offers total creative freedom, SciChart offers full customizations. SciChart’s API is designed for complexity, allowing you to create custom themes, unique chart types, and bespoke interactions that align perfectly with your brand. Because we use Visual Xccelerator™, you get this flexibility without sacrificing the native feel.
SciChart’s flexibility allows you to create truly bespoke finance and trading applications that look, feel and act exactly as you want. Whitelabelling capabilities also means that it’s clear this is your app, and unique to the marketplace. We can even allow visualizations that are not possible with TradingView, such as visualizing market depth charts and order book heatmaps.
TradingView, while a great library, is a JavaScript only plugin. This is fine for web apps but limits the ability to create native mobile apps. Embedding a JS component inside a native mobile app is a very suboptimal technology choice, and will limit the frameworks you can use. It can also impact the overall look, feel, UX and performance of your app.
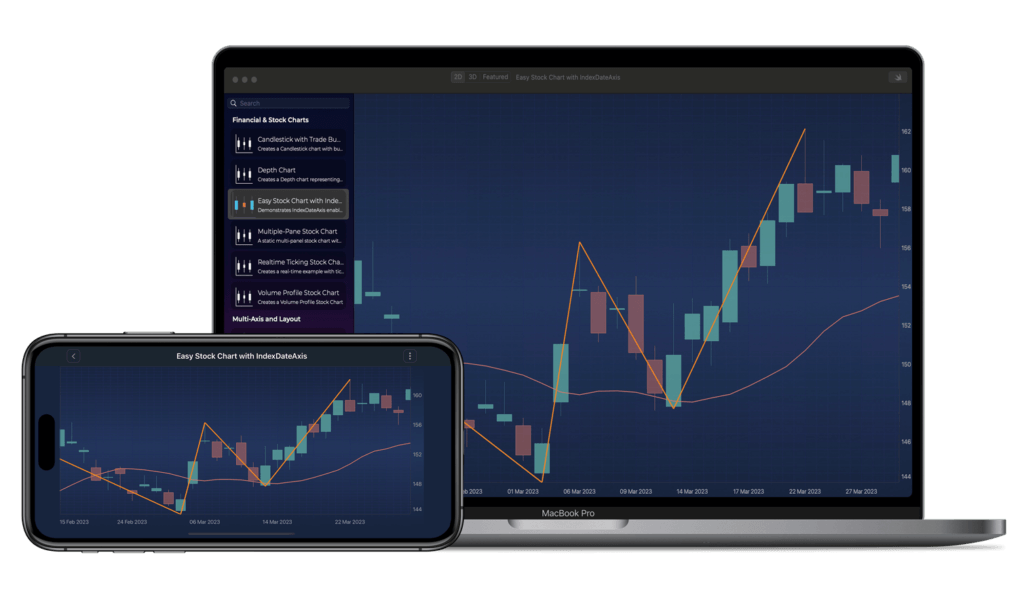
If you want to create a native mobile trading application on iOS/Android and your technology of choice is Swift / Kotlin, then your only choice is SciChart. It has native chart libraries for iOS/Android, using Metal / OpenGL hardware acceleration and built for XCode / Android studio. This enables teams to build a consistent trading experience across web, desktop, and mobile using a shared API and feature set, creating a familiar ecosystem for users without sacrificing performance.
The right choice depends on your specific goals. If you are building a simple blog or a retail-focused web dashboard where branding doesn’t matter, a free TradingView widget might suffice.
For professional-grade financial apps that need to visualize big data, more than the limits imposed by TradingView of ~4,000 candles, SciChart is one of the best alternatives to TradingView. We’re able to visualize the entire history of Bitcoin as a 1-minute chart, making it perfect for HFT, Quantitative Trading, and highly customized trading apps in browser (JavaScript) as well as native iOS/Android apps.
Despite the technical advantages of an SDK, there are specific scenarios where TradingView remains a compelling choice. If your project is a simple web-based retail dashboard or a blog that needs a plug-and-play solution with zero coding time, their widgets are sophisticated.
They also come pre-integrated with a massive library of technical indicators and a social ecosystem that some users find helpful. If your priority is a community-driven look and you don’t mind their branding, TradingView is a suitable option for lightweight web use.
As an alternative to TradingView, SciChart is the right choice when your application moves beyond simple reporting. If you’re building for sectors like Formula 1 telemetry, medical imaging, or high-frequency trading, where signal fidelity is a matter of safety or extreme profit, you cannot afford the limitations of a standard web widget.
SciChart’s ability to display 10 million candles (over 2x more than TradingView) makes it perfect for high frequency trading systems, or custom trading applications that need to view more data.
It is also the right call when you require double-precision (64-bit) numerical calculations to ensure your data integrity is preserved without approximation shortcuts.
It’s also the strategic choice for teams building native mobile apps. While other libraries rely on clunky web-views that drain battery and stutter, SciChart’s native iOS and Android chart libraries leverage Metal and OpenGL directly.
This ensures that your users get a smooth 60 FPS experience even on older hardware. If you want to own your UI, keep your licensing costs predictable as you scale, and have a direct line to a support team that includes an AI assistant, SciChart is the platform for your fintech charts.
Leading exchanges are increasingly moving toward native solutions to maintain their competitive edge. Bithumb, one of South Korea’s largest crypto exchanges, recently integrated SciChart to power their live crypto charts. They needed a solution that remained stable and responsive even during periods of extreme market volatility.
By utilizing SciChart’s GPU-accelerated engine, Bithumb can now process high-frequency data streams for over 2 million mobile traders. This shift allowed them to provide a smooth, transparent trading environment that supports complex indicators like moving averages and Bollinger Bands natively on mobile devices.
This level of control and performance is why SciChart is used by global financial institutions and high-scale trading platforms, including Commerzbank, JPMorgan Chase & Co., and major crypto exchanges. These organizations rely on SciChart to support complex, high-frequency data workloads and millions of end users without compromising user experience.
Give SciChart a Try Today
If your current library is slowing down your development or your app, why not switch to a library that can handle wider data ranges, support full customization and supports native mobile apps? Whether you require WPF charts for a desktop terminal or a JavaScript solution for the web, we provide the UX experience your users expect.
SciChart’s enterprise support and dedicated AI assistant are here to ensure your integration is seamless.
Try SciChart’s financial and trading charts and experience the power of the Visual Xccelerator™ engine. You can also Download the SciTrader App to see SciChart’s technology in action on mobile.
Recent Blogs
![]()
Queens Award for Innovation
Proud winners of the Queens Award for Innovation, 2019. Awarded on account of our innovative graphics engine which underpins the SciChart library and enables our world-beating charting performance
![]()
National Business Awards
Highly Commended for Lloyds National Business Awards, 2019. Awarded on account of our innovative graphics engine and impressive customer base
![]()
National Technology Awards
Awarded “Healthcare Tech of the Year” at the 2025 National Technology Awards – a top UK recognition for breakthrough innovation in technology.

Reviews
SciChart has received hundreds of verified, 3rd party reviews