SciChart® the market leader in Fast WPF Charts, WPF 3D Charts, iOS Chart, Android Chart and JavaScript Chart Components
SciChart Android ships with ~90Â Android Chart Examples which you can browse, play with, view the source-code and even export each SciChart Android Chart Example to a stand-alone Android Studio project. All of this is possible with the new and improved SciChart Android Examples Suite, which ships as part of our Android Charts SDK.
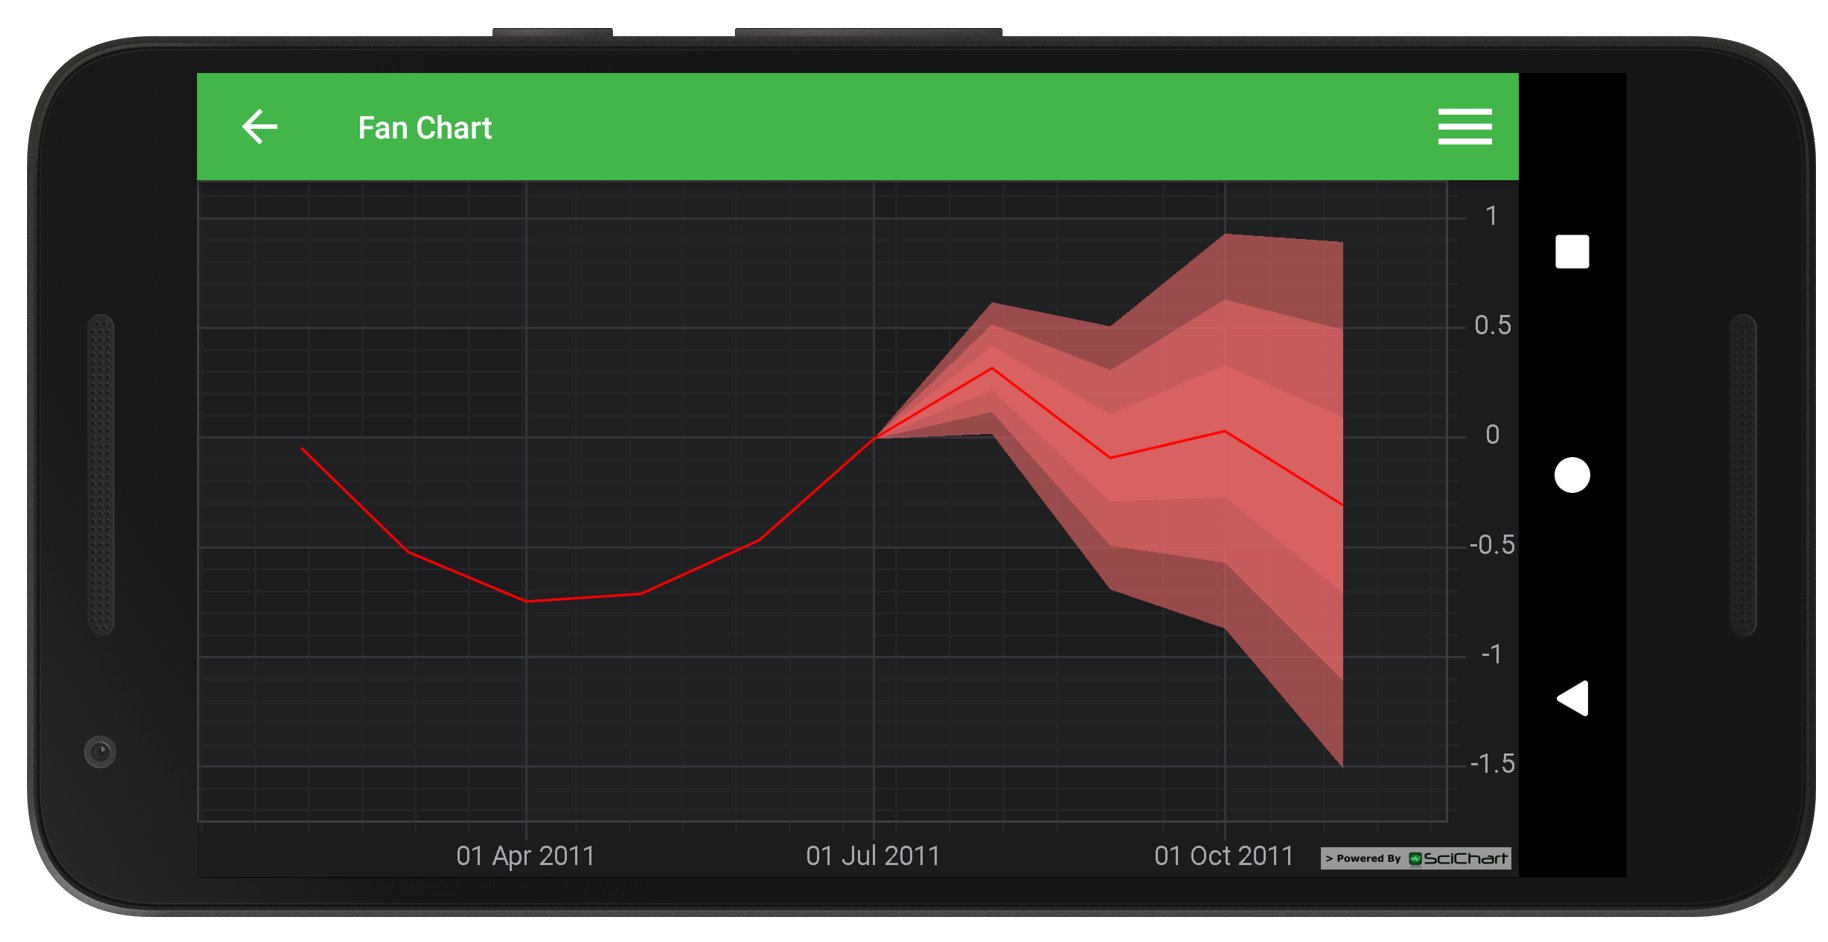
Demonstrates how to use multiple FastBandRenderableSeries to simulate a Fan Chart. The FastBandRenderableSeries requires an XyyDataSeries, which has X,Y0,Y1 points, to display a solid band between high and low Y-value.
Tip!
In this example, we overlay several Band-Series with varying opacity to simulate a Fan-chart.
The full source code for the Android Fan Chart example is included below (Scroll down!).
Did you know you can also view the source code from one of the following sources as well?
<?xml version="1.0" encoding="utf-8"?><!--*************************************************************************-->
<!-- SCICHART® Copyright SciChart Ltd. 2011-2016. All rights reserved. -->
<!-- -->
<!-- Web: http://www.scichart.com -->
<!-- Support: support@scichart.com -->
<!-- Sales: sales@scichart.com -->
<!-- -->
<!-- example_single_chart_fragment.xml is part of the SCICHART® Examples. Permission is hereby granted -->
<!-- to modify, create derivative works, distribute and publish any part of this source -->
<!-- code whether for commercial, private or personal use. -->
<!-- -->
<!-- The SCICHART® examples are distributed in the hope that they will be useful, but -->
<!-- without any warranty. It is provided "AS IS" without warranty of any kind, either -->
<!-- expressed or implied. -->
<!--*************************************************************************-->
<LinearLayout xmlns:android="http://schemas.android.com/apk/res/android"
android:layout_width="match_parent"
android:layout_height="match_parent"
android:orientation="vertical">
<com.scichart.charting.visuals.SciChartSurface
android:id="@+id/chart"
android:layout_width="fill_parent"
android:layout_height="fill_parent" />
</LinearLayout>
//******************************************************************************
// SCICHART® Copyright SciChart Ltd. 2011-2017. All rights reserved.
//
// Web: http://www.scichart.com
// Support: support@scichart.com
// Sales: sales@scichart.com
//
// FanChartFragment.java is part of the SCICHART® Examples. Permission is hereby granted
// to modify, create derivative works, distribute and publish any part of this source
// code whether for commercial, private or personal use.
//
// The SCICHART® examples are distributed in the hope that they will be useful, but
// without any warranty. It is provided "AS IS" without warranty of any kind, either
// expressed or implied.
//******************************************************************************
package com.scichart.examples.fragments;
import android.view.animation.DecelerateInterpolator;
import com.scichart.charting.model.dataSeries.XyDataSeries;
import com.scichart.charting.model.dataSeries.XyyDataSeries;
import com.scichart.charting.visuals.SciChartSurface;
import com.scichart.charting.visuals.axes.IAxis;
import com.scichart.charting.visuals.renderableSeries.FastBandRenderableSeries;
import com.scichart.charting.visuals.renderableSeries.FastLineRenderableSeries;
import com.scichart.core.common.Func1;
import com.scichart.core.framework.UpdateSuspender;
import com.scichart.core.utility.IterableUtil;
import com.scichart.drawing.utility.ColorUtil;
import com.scichart.examples.R;
import com.scichart.examples.data.RandomWalkGenerator;
import com.scichart.examples.fragments.base.ExampleBaseFragment;
import java.util.ArrayList;
import java.util.Calendar;
import java.util.Collections;
import java.util.Date;
import java.util.List;
import butterknife.BindView;
public class FanChartFragment extends ExampleBaseFragment {
@BindView(R.id.chart)
SciChartSurface surface;
@Override
protected int getLayoutId() {
return R.layout.example_single_chart_fragment;
}
@Override
protected void initExample() {
final IAxis xAxis = sciChartBuilder.newDateAxis().withGrowBy(0.1, 0.1).build();
final IAxis yAxis = sciChartBuilder.newNumericAxis().withGrowBy(0.1, 0.1).build();
final XyDataSeries<Date, Double> actualDataSeries = sciChartBuilder.newXyDataSeries(Date.class, Double.class).build();
final XyyDataSeries<Date, Double> var3DataSeries = sciChartBuilder.newXyyDataSeries(Date.class, Double.class).build();
final XyyDataSeries<Date, Double> var2DataSeries = sciChartBuilder.newXyyDataSeries(Date.class, Double.class).build();
final XyyDataSeries<Date, Double> var1DataSeries = sciChartBuilder.newXyyDataSeries(Date.class, Double.class).build();
final List<VarPoint> varianceData = getVarianceData();
for (int i = 0; i < varianceData.size(); i++) {
final VarPoint dataPoint = varianceData.get(i);
actualDataSeries.append(dataPoint.date, dataPoint.actual);
var3DataSeries.append(dataPoint.date, dataPoint.varMin, dataPoint.varMax);
var2DataSeries.append(dataPoint.date, dataPoint.var1, dataPoint.var4);
var1DataSeries.append(dataPoint.date, dataPoint.var2, dataPoint.var3);
}
final FastBandRenderableSeries projectedVar3 = sciChartBuilder.newBandSeries().withDataSeries(var3DataSeries).withStrokeY1Style(ColorUtil.Transparent).withStrokeStyle(ColorUtil.Transparent).build();
final FastBandRenderableSeries projectedVar2 = sciChartBuilder.newBandSeries().withDataSeries(var2DataSeries).withStrokeY1Style(ColorUtil.Transparent).withStrokeStyle(ColorUtil.Transparent).build();
final FastBandRenderableSeries projectedVar = sciChartBuilder.newBandSeries().withDataSeries(var1DataSeries).withStrokeY1Style(ColorUtil.Transparent).withStrokeStyle(ColorUtil.Transparent).build();
final FastLineRenderableSeries lineSeries = sciChartBuilder.newLineSeries().withDataSeries(actualDataSeries).withStrokeStyle(ColorUtil.Red, 1f).build();
UpdateSuspender.using(surface, new Runnable() {
@Override
public void run() {
Collections.addAll(surface.getXAxes(), xAxis);
Collections.addAll(surface.getYAxes(), yAxis);
Collections.addAll(surface.getRenderableSeries(), projectedVar3, projectedVar2, projectedVar, lineSeries);
Collections.addAll(surface.getChartModifiers(), sciChartBuilder.newModifierGroupWithDefaultModifiers().build());
sciChartBuilder.newAnimator(lineSeries).withWaveTransformation().withInterpolator(new DecelerateInterpolator()).withDuration(3000).withStartDelay(350).start();
sciChartBuilder.newAnimator(projectedVar).withWaveTransformation().withInterpolator(new DecelerateInterpolator()).withDuration(3000).withStartDelay(350).start();
sciChartBuilder.newAnimator(projectedVar2).withWaveTransformation().withInterpolator(new DecelerateInterpolator()).withDuration(3000).withStartDelay(350).start();
sciChartBuilder.newAnimator(projectedVar3).withWaveTransformation().withInterpolator(new DecelerateInterpolator()).withDuration(3000).withStartDelay(350).start();
}
});
}
// Create a table of Variance data. Each row in the table consists of
//
// DateTime, Actual (Y-Value), Projected Min, Variance 1, 2, 3, 4 and Projected Maximum
//
// DateTime Actual Min Var1 Var2 Var3 Var4 Max
// Jan-11 y0 - - - - - -
// Feb-11 y1 - - - - - -
// Mar-11 y2 - - - - - -
// Apr-11 y3 - - - - - -
// May-11 y4 - - - - - -
// Jun-11 y5 min0 var1_0 var2_0 var3_0 var4_0 max_0
// Jul-11 y6 min1 var1_1 var2_1 var3_1 var4_1 max_1
// Aug-11 y7 min2 var1_2 var2_2 var3_2 var4_2 max_2
// Dec-11 y8 min3 var1_3 var2_3 var3_3 var4_3 max_3
// Jan-12 y9 min4 var1_4 var2_4 var3_4 var4_4 max_4
private static List<VarPoint> getVarianceData() {
final int count = 10;
final Date[] dates = IterableUtil.toArray(IterableUtil.range(0, count, new Func1<Integer, Date>() {
@Override
public Date func(Integer arg) {
final Calendar instance = Calendar.getInstance();
instance.clear();
instance.set(2011, 1, 1);
instance.add(Calendar.MONTH, arg);
return instance.getTime();
}
}), Date.class);
final double[] yValues = new RandomWalkGenerator().getRandomWalkSeries(count).yValues.getItemsArray();
final List<VarPoint> result = new ArrayList<>();
for (int i = 0; i < count; i++) {
double varMax = Double.NaN;
double var4 = Double.NaN;
double var3 = Double.NaN;
double var2 = Double.NaN;
double var1 = Double.NaN;
double varMin = Double.NaN;
if (i > 4) {
varMax = yValues[i] + (i - 5) * 0.3;
var4 = yValues[i] + (i - 5) * 0.2;
var3 = yValues[i] + (i - 5) * 0.1;
var2 = yValues[i] - (i - 5) * 0.1;
var1 = yValues[i] - (i - 5) * 0.2;
varMin = yValues[i] - (i - 5) * 0.3;
}
result.add(new VarPoint(dates[i], yValues[i], var4, var3, var2, var1, varMin, varMax));
}
return result;
}
private static class VarPoint {
public final Date date;
public final double actual;
public final double varMax;
public final double var4;
public final double var3;
public final double var2;
public final double var1;
public final double varMin;
public VarPoint(Date date, double actual, double var4, double var3, double var2, double var1, double varMin, double varMax) {
this.date = date;
this.actual = actual;
this.var4 = var4;
this.var3 = var3;
this.var2 = var2;
this.var1 = var1;
this.varMin = varMin;
this.varMax = varMax;
}
}
}