SciChart® the market leader in Fast WPF Charts, WPF 3D Charts, iOS Chart, Android Chart and JavaScript Chart Components
SciChart Android ships with ~90 Android Chart Examples which you can browse, play with, view the source-code and even export each SciChart Android Chart Example to a stand-alone Android Studio project. All of this is possible with the new and improved SciChart Android Examples Suite, which ships as part of our Android Charts SDK.
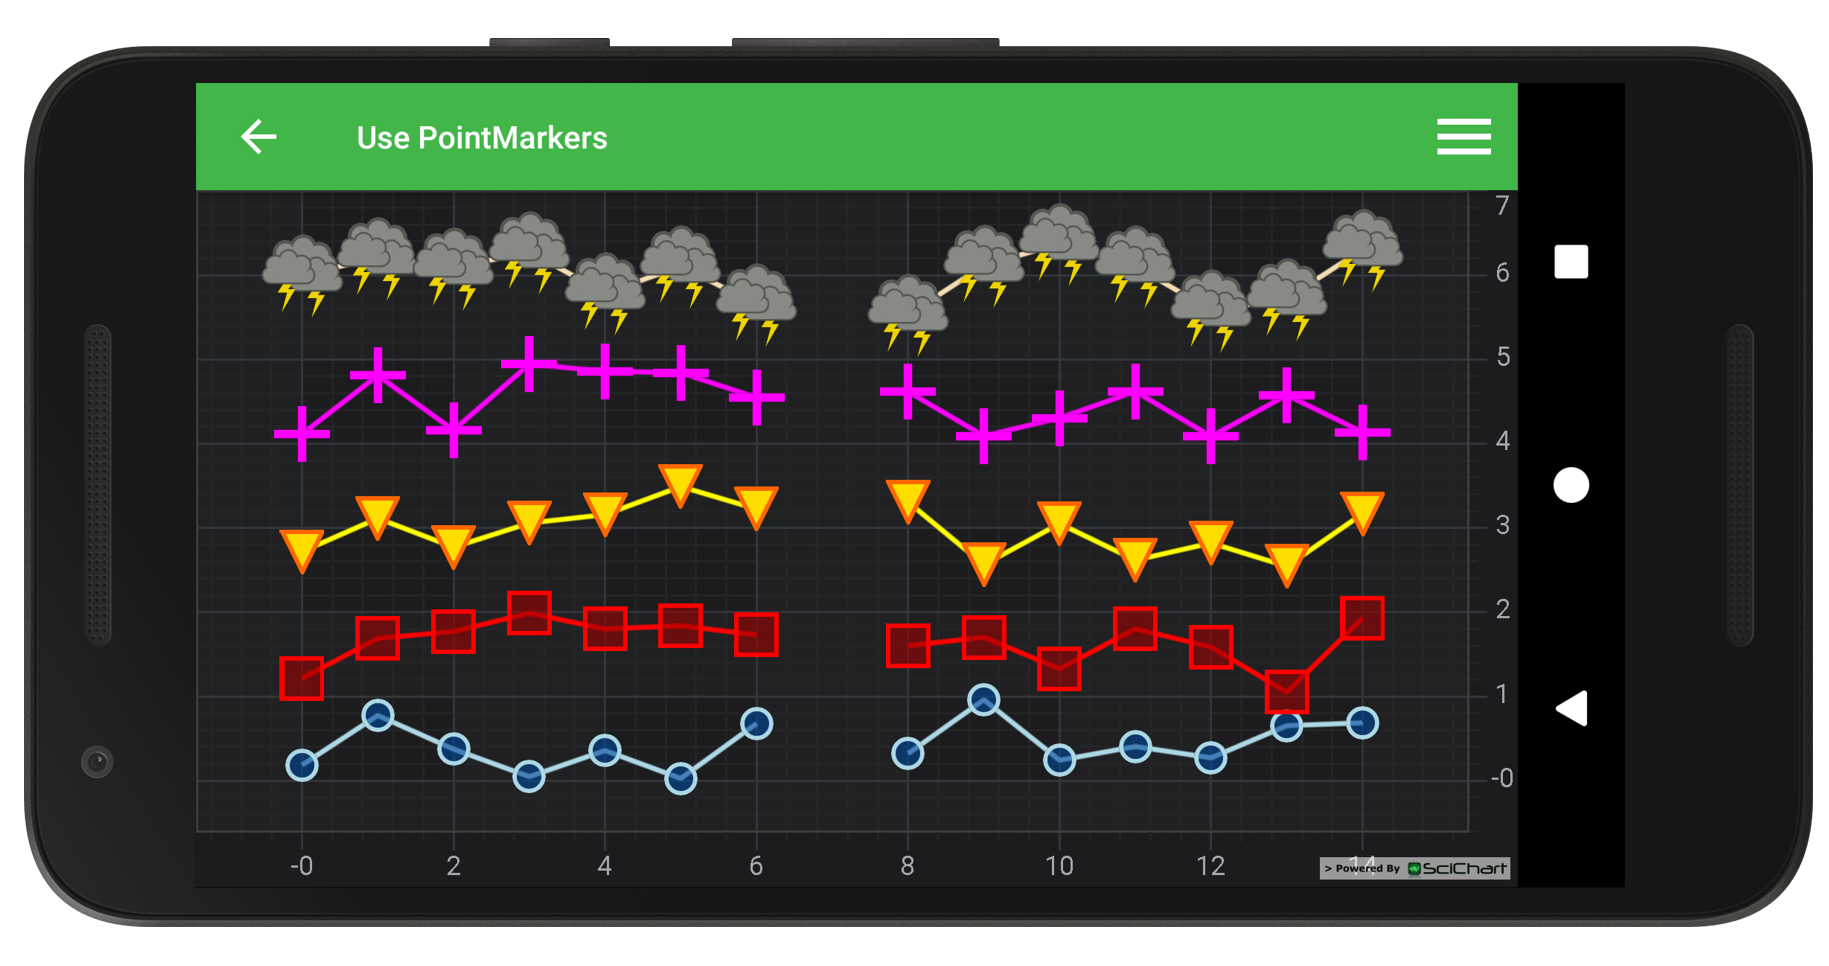
Demonstrates the PointMarker API which allows data-point markers to be added to many RenderableSeries types.
Now built-in types handle Ellipse, Square, Cross, Triangle and a special type which allows to draw point marker via Canvas API (SpritePointMarker), so it’s possible to render tens or hundreds of thousands of point-markers using this method.
It is also possible to create custom PointMarkers by extending our SpritePointMarker or DrawablePointMarker type.
The full source code for the Android Chart Pointmarkers example is included below (Scroll down!).
Did you know you can also view the source code from one of the following sources as well?
//******************************************************************************
// SCICHART® Copyright SciChart Ltd. 2011-2021. All rights reserved.
//
// Web: http://www.scichart.com
// Support: support@scichart.com
// Sales: sales@scichart.com
//
// UsePointMarkersFragment.kt is part of SCICHART®, High Performance Scientific Charts
// For full terms and conditions of the license, see http://www.scichart.com/scichart-eula/
//
// This source code is protected by international copyright law. Unauthorized
// reproduction, reverse-engineering, or distribution of all or any portion of
// this source code is strictly prohibited.
//
// This source code contains confidential and proprietary trade secrets of
// SciChart Ltd., and should at no time be copied, transferred, sold,
// distributed or made available without express written permission.
//******************************************************************************
package com.scichart.examples.fragments.examples2d.stylingAndTheming.kt
import android.content.Context
import android.graphics.Canvas
import android.graphics.Paint
import androidx.annotation.DrawableRes
import androidx.core.content.res.ResourcesCompat
import com.scichart.charting.model.dataSeries.IXyDataSeries
import com.scichart.charting.visuals.SciChartSurface
import com.scichart.charting.visuals.pointmarkers.SpritePointMarker.ISpritePointMarkerDrawer
import com.scichart.data.model.DoubleRange
import com.scichart.drawing.utility.ColorUtil
import com.scichart.examples.R
import com.scichart.examples.fragments.base.ExampleSingleChartBaseFragment
import com.scichart.examples.utils.scichartExtensions.*
import java.util.*
class UsePointMarkersFragment : ExampleSingleChartBaseFragment() {
override fun initExample(surface: SciChartSurface) {
surface.suspendUpdates {
xAxes { numericAxis { growBy = DoubleRange(0.1, 0.1) } }
yAxes { numericAxis { growBy = DoubleRange(0.1, 0.1) } }
renderableSeries {
fastLineRenderableSeries {
xyDataSeries<Double, Double> { fillDataSeries(this) }
strokeStyle = SolidPenStyle(ColorUtil.LightBlue, 2f)
ellipsePointMarker {
setSize(15)
fillStyle = SolidBrushStyle(0x990077ff)
strokeStyle = SolidPenStyle(ColorUtil.LightBlue, 2f)
}
opacityAnimation { duration = 1000 }
}
fastLineRenderableSeries {
xyDataSeries<Double, Double> { fillDataSeries(this, 1.0) }
strokeStyle = SolidPenStyle(ColorUtil.Red, 2f)
squarePointMarker {
setSize(20)
fillStyle = SolidBrushStyle(0x99ff0000)
strokeStyle = SolidPenStyle(ColorUtil.Red, 2f)
}
opacityAnimation { duration = 1000 }
}
fastLineRenderableSeries {
xyDataSeries<Double, Double> { fillDataSeries(this, 2.5) }
strokeStyle = SolidPenStyle(ColorUtil.Yellow, 2f)
trianglePointMarker {
setSize(20)
fillStyle = SolidBrushStyle(0xffffdd00)
strokeStyle = SolidPenStyle(0xffff6600, 2f)
}
opacityAnimation { duration = 1000 }
}
fastLineRenderableSeries {
xyDataSeries<Double, Double> { fillDataSeries(this, 4.0) }
strokeStyle = SolidPenStyle(ColorUtil.Magenta, 2f)
crossPointMarker {
setSize(25)
strokeStyle = SolidPenStyle(ColorUtil.Magenta, 4f)
}
opacityAnimation { duration = 1000 }
}
fastLineRenderableSeries {
xyDataSeries<Double, Double> { fillDataSeries(this, 5.5) }
strokeStyle = SolidPenStyle(ColorUtil.Wheat, 2f)
spritePointMarker(CustomPointMarkerDrawer(this@suspendUpdates.context, R.drawable.example_weather_storm)) {
setSize(15)
fillStyle = SolidBrushStyle(0x990077ff)
strokeStyle = SolidPenStyle(ColorUtil.LightBlue, 2f)
}
opacityAnimation { duration = 1000 }
}
}
chartModifiers { defaultModifiers() }
}
}
private fun fillDataSeries(dataSeries: IXyDataSeries<Double, Double>, offset: Double = 0.0) {
for (i in 0 until dataSize) {
dataSeries.append(i.toDouble(), offset + rnd.nextDouble())
}
dataSeries.updateYAt(7, Double.NaN)
}
private class CustomPointMarkerDrawer(context: Context, @DrawableRes drawableId: Int) : ISpritePointMarkerDrawer {
private val drawable = ResourcesCompat.getDrawable(context.resources, drawableId, null)
override fun onDraw(canvas: Canvas, stroke: Paint, fill: Paint) {
drawable?.run {
setBounds(0, 0, canvas.width, canvas.height)
draw(canvas)
}
}
}
companion object {
val rnd = Random()
const val dataSize = 15
}
}
//******************************************************************************
// SCICHART® Copyright SciChart Ltd. 2011-2021. All rights reserved.
//
// Web: http://www.scichart.com
// Support: support@scichart.com
// Sales: sales@scichart.com
//
// UsePointMarkersFragment.java is part of SCICHART®, High Performance Scientific Charts
// For full terms and conditions of the license, see http://www.scichart.com/scichart-eula/
//
// This source code is protected by international copyright law. Unauthorized
// reproduction, reverse-engineering, or distribution of all or any portion of
// this source code is strictly prohibited.
//
// This source code contains confidential and proprietary trade secrets of
// SciChart Ltd., and should at no time be copied, transferred, sold,
// distributed or made available without express written permission.
//******************************************************************************
package com.scichart.examples.fragments.examples2d.stylingAndTheming;
import android.content.Context;
import android.graphics.Canvas;
import android.graphics.Paint;
import android.graphics.drawable.Drawable;
import androidx.annotation.DrawableRes;
import androidx.annotation.NonNull;
import androidx.core.content.res.ResourcesCompat;
import com.scichart.charting.model.dataSeries.IXyDataSeries;
import com.scichart.charting.model.dataSeries.XyDataSeries;
import com.scichart.charting.visuals.SciChartSurface;
import com.scichart.charting.visuals.pointmarkers.CrossPointMarker;
import com.scichart.charting.visuals.pointmarkers.EllipsePointMarker;
import com.scichart.charting.visuals.pointmarkers.IPointMarker;
import com.scichart.charting.visuals.pointmarkers.SpritePointMarker;
import com.scichart.charting.visuals.pointmarkers.SquarePointMarker;
import com.scichart.charting.visuals.pointmarkers.TrianglePointMarker;
import com.scichart.charting.visuals.renderableSeries.IRenderableSeries;
import com.scichart.data.model.DoubleRange;
import com.scichart.drawing.utility.ColorUtil;
import com.scichart.examples.R;
import com.scichart.examples.fragments.base.ExampleSingleChartBaseFragment;
import java.util.Collections;
import java.util.Random;
public class UsePointMarkersFragment extends ExampleSingleChartBaseFragment {
private static final int dataSize = 15;
private final Random rnd = new Random();
@Override
protected void initExample(@NonNull SciChartSurface surface) {
final IXyDataSeries<Double, Double> ds1 = new XyDataSeries<>(Double.class, Double.class);
final IXyDataSeries<Double, Double> ds2 = new XyDataSeries<>(Double.class, Double.class);
final IXyDataSeries<Double, Double> ds3 = new XyDataSeries<>(Double.class, Double.class);
final IXyDataSeries<Double, Double> ds4 = new XyDataSeries<>(Double.class, Double.class);
final IXyDataSeries<Double, Double> ds5 = new XyDataSeries<>(Double.class, Double.class);
fillDataSeries(ds1, 0);
fillDataSeries(ds2, 1);
fillDataSeries(ds3, 2.5);
fillDataSeries(ds4, 4);
fillDataSeries(ds5, 5.5);
final IPointMarker pointMarker1 = sciChartBuilder.newPointMarker(new EllipsePointMarker()).withSize(15,15).withFill(0x990077ff).withStroke(ColorUtil.LightBlue, 2).build();
final IPointMarker pointMarker2 = sciChartBuilder.newPointMarker(new SquarePointMarker()).withSize(20, 20).withFill(0x99ff0000).withStroke(ColorUtil.Red, 2).build();
final IPointMarker pointMarker3 = sciChartBuilder.newPointMarker(new TrianglePointMarker()).withSize(20, 20).withFill(0xffffdd00).withStroke(0xffff6600, 2).build();
final IPointMarker pointMarker4 = sciChartBuilder.newPointMarker(new CrossPointMarker()).withSize(25, 25).withStroke(ColorUtil.Magenta, 4).build();
final IPointMarker pointMarker5 = sciChartBuilder.newPointMarker(new SpritePointMarker(new CustomPointMarkerDrawer(requireContext(), R.drawable.example_weather_storm))).withSize(40, 40).build();
IRenderableSeries rs1 = sciChartBuilder.newLineSeries().withDataSeries(ds1).withPointMarker(pointMarker1).withStrokeStyle(ColorUtil.LightBlue, 2f).build();
IRenderableSeries rs2 = sciChartBuilder.newLineSeries().withDataSeries(ds2).withPointMarker(pointMarker2).withStrokeStyle(ColorUtil.Red, 2f).build();
IRenderableSeries rs3 = sciChartBuilder.newLineSeries().withDataSeries(ds3).withPointMarker(pointMarker3).withStrokeStyle(ColorUtil.Yellow, 2f).build();
IRenderableSeries rs4 = sciChartBuilder.newLineSeries().withDataSeries(ds4).withPointMarker(pointMarker4).withStrokeStyle(ColorUtil.Magenta, 2f).build();
IRenderableSeries rs5 = sciChartBuilder.newLineSeries().withDataSeries(ds5).withPointMarker(pointMarker5).withStrokeStyle(ColorUtil.Wheat, 2f).build();
Collections.addAll(surface.getXAxes(), sciChartBuilder.newNumericAxis().withGrowBy(new DoubleRange(0.1, 0.1)).build());
Collections.addAll(surface.getYAxes(), sciChartBuilder.newNumericAxis().withGrowBy(new DoubleRange(0.1, 0.1)).build());
Collections.addAll(surface.getRenderableSeries(), rs1, rs2, rs3, rs4, rs5);
Collections.addAll(surface.getChartModifiers(), sciChartBuilder.newModifierGroupWithDefaultModifiers().build());
sciChartBuilder.newOpacityAnimator(rs1).withDuration(1000).withStartDelay(350).start();
sciChartBuilder.newOpacityAnimator(rs2).withDuration(1000).withStartDelay(350).start();
sciChartBuilder.newOpacityAnimator(rs3).withDuration(1000).withStartDelay(350).start();
sciChartBuilder.newOpacityAnimator(rs4).withDuration(1000).withStartDelay(350).start();
sciChartBuilder.newOpacityAnimator(rs5).withDuration(1000).withStartDelay(350).start();
}
private void fillDataSeries(IXyDataSeries<Double, Double> dataSeries, double offset) {
for (int i = 0; i < dataSize; i++) {
dataSeries.append((double)i, offset + rnd.nextDouble());
}
dataSeries.updateYAt(7, Double.NaN);
}
private static class CustomPointMarkerDrawer implements SpritePointMarker.ISpritePointMarkerDrawer {
private final Drawable drawable;
CustomPointMarkerDrawer(Context context, @DrawableRes int drawableId) {
this.drawable = ResourcesCompat.getDrawable(context.getResources(), drawableId, null);
}
@Override
public void onDraw(Canvas canvas, Paint stroke, Paint fill) {
drawable.setBounds(0, 0, canvas.getWidth(), canvas.getHeight());
drawable.draw(canvas);
}
}
}