SciChart® the market leader in Fast WPF Charts, WPF 3D Charts, iOS Chart, Android Chart and JavaScript Chart Components
SciChart Android ships with ~90 Android Chart Examples which you can browse, play with, view the source-code and even export each SciChart Android Chart Example to a stand-alone Android Studio project. All of this is possible with the new and improved SciChart Android Examples Suite, which ships as part of our Android Charts SDK.
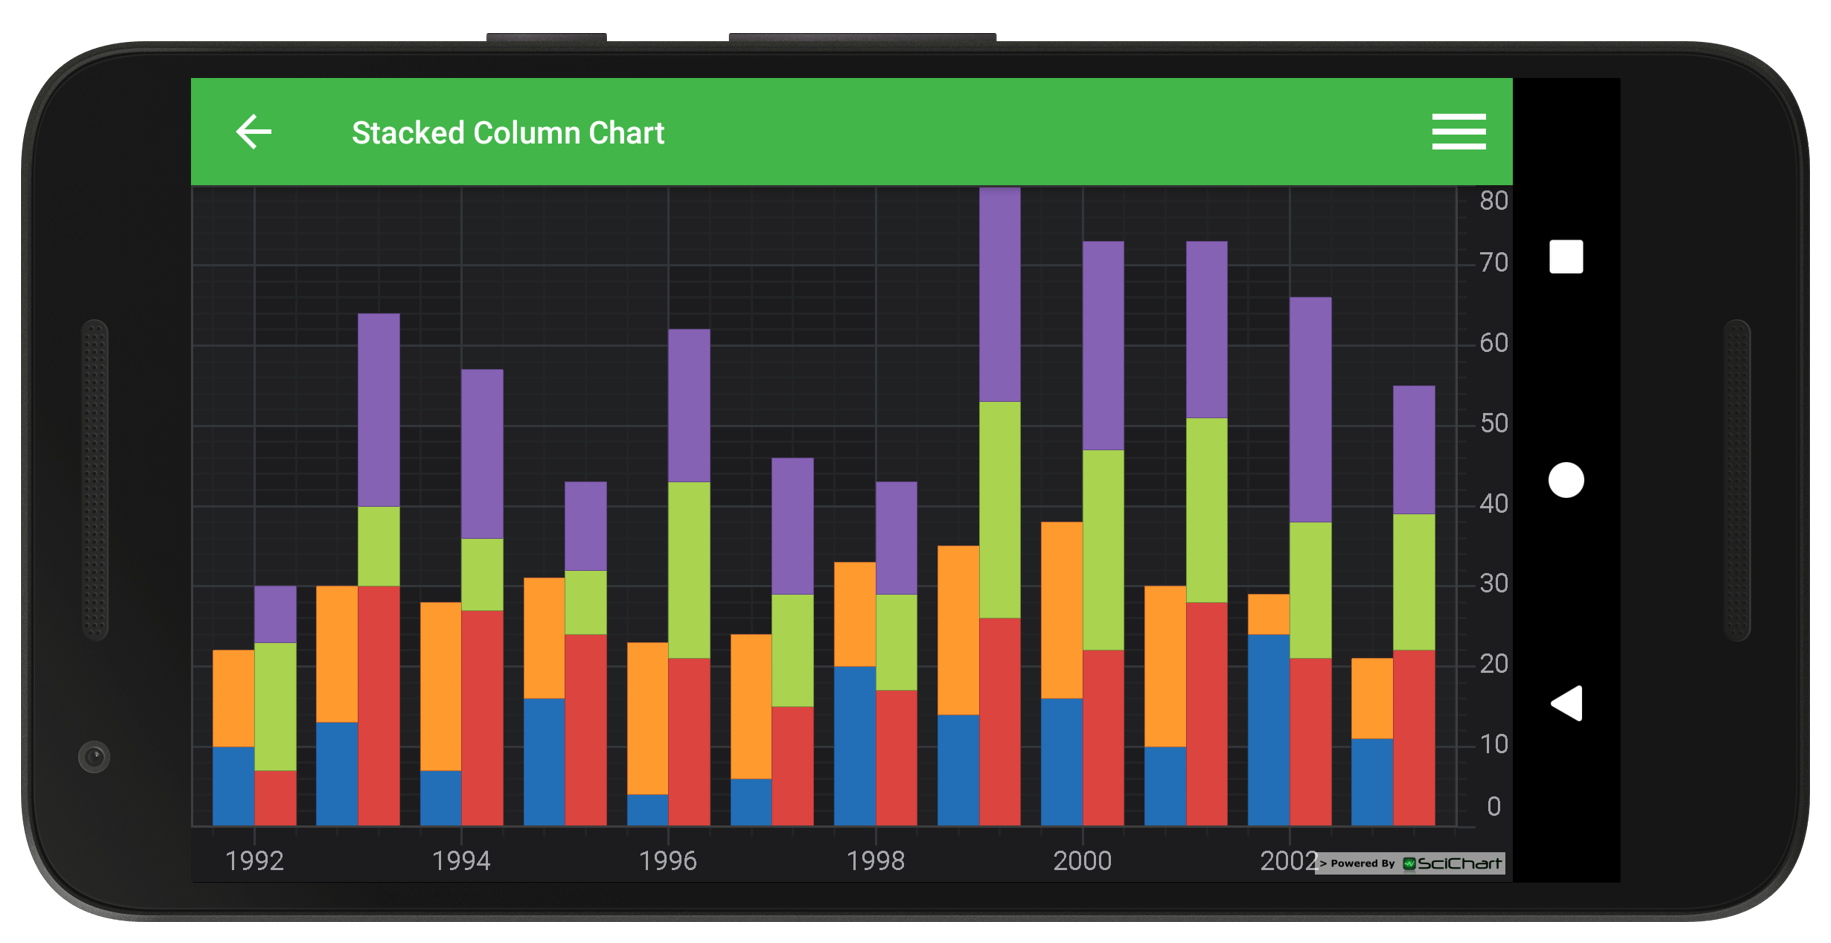
Demonstrates how to use Stacked Column API in SciChart Android.
When you add multiple StackedColumnRenderableSeries into VerticallyStackedColumnsCollection for vertical grouping or into HorizontallyStackedColumnsCollection for horizontal grouping it allows to render them stacked one above another or side by side. Data provided by its DataSeries can be used to render an XyDataSeries (which contains one X-point and one Y-point), XyyDataSeries (renders Y values), XyzDataSeries, HlDataSeries and OhlcDataSeries(renders Close values). Columns are drawn using the pens provided by the setStrokeStyle(PenStyle) (outline) and using the Brush provided by the setFillBrushStyle(BrushStyle) (fill).
Tip!
Do you need to change the width of a column? Try calling the setDataPointWidth() method passing in any number from 0.0 to 1.0. This alters how much space a column takes up.
The full source code for the Android Stacked Column Chart example is included below (Scroll down!).
Did you know you can also view the source code from one of the following sources as well?
//******************************************************************************
// SCICHART® Copyright SciChart Ltd. 2011-2021. All rights reserved.
//
// Web: http://www.scichart.com
// Support: support@scichart.com
// Sales: sales@scichart.com
//
// StackedColumnChartFragment.kt is part of SCICHART®, High Performance Scientific Charts
// For full terms and conditions of the license, see http://www.scichart.com/scichart-eula/
//
// This source code is protected by international copyright law. Unauthorized
// reproduction, reverse-engineering, or distribution of all or any portion of
// this source code is strictly prohibited.
//
// This source code contains confidential and proprietary trade secrets of
// SciChart Ltd., and should at no time be copied, transferred, sold,
// distributed or made available without express written permission.
//******************************************************************************
package com.scichart.examples.fragments.examples2d.multiChart.kt
import android.view.animation.DecelerateInterpolator
import com.scichart.charting.modifiers.ZoomExtentsModifier
import com.scichart.charting.visuals.SciChartSurface
import com.scichart.examples.fragments.base.ExampleSingleChartBaseFragment
import com.scichart.examples.utils.scichartExtensions.*
class StackedColumnChartFragment: ExampleSingleChartBaseFragment() {
override fun initExample(surface: SciChartSurface) {
surface.suspendUpdates {
xAxes { numericAxis() }
yAxes { numericAxis() }
renderableSeries {
horizontallyStackedColumnsCollection {
spacing = 0.0
verticallyStackedColumnsCollection {
stackedColumnRenderableSeries {
xyDataSeries<Double, Double>("Pork Series") {
for (i in porkData.indices) append((initialDate + i).toDouble(), porkData[i])
}
fillBrushStyle = SolidBrushStyle(0xff226fb7)
strokeStyle = SolidPenStyle(0xff22579D, 0f)
waveAnimation { interpolator = DecelerateInterpolator() }
}
stackedColumnRenderableSeries {
xyDataSeries<Double, Double>("Veal Series") {
for (i in vealData.indices) append((initialDate + i).toDouble(), vealData[i])
}
fillBrushStyle = SolidBrushStyle(0xffff9a2e)
strokeStyle = SolidPenStyle(0xffBE642D, 0f)
waveAnimation { interpolator = DecelerateInterpolator() }
}
}
verticallyStackedColumnsCollection {
stackedColumnRenderableSeries {
xyDataSeries<Double, Double>("Tomato Series") {
for (i in tomatoesData.indices) append((initialDate + i).toDouble(), tomatoesData[i])
}
fillBrushStyle = SolidBrushStyle(0xffdc443f)
strokeStyle = SolidPenStyle(0xffA33631, 0f)
waveAnimation { interpolator = DecelerateInterpolator() }
}
stackedColumnRenderableSeries {
xyDataSeries<Double, Double>("Cucumber Series") {
for (i in cucumberData.indices) append((initialDate + i).toDouble(), cucumberData[i])
}
fillBrushStyle = SolidBrushStyle(0xffaad34f)
strokeStyle = SolidPenStyle(0xff73953D, 0f)
waveAnimation { interpolator = DecelerateInterpolator() }
}
stackedColumnRenderableSeries {
xyDataSeries<Double, Double>("Pepper Series") {
for (i in pepperData.indices) append((initialDate + i).toDouble(), pepperData[i])
}
fillBrushStyle = SolidBrushStyle(0xff8562b4)
strokeStyle = SolidPenStyle(0xff64458A, 0f)
waveAnimation { interpolator = DecelerateInterpolator() }
}
}
}
}
chartModifiers {
rolloverModifier()
ZoomExtentsModifier()
}
}
}
companion object {
const val initialDate = 1992
val porkData = doubleArrayOf(10.0, 13.0, 7.0, 16.0, 4.0, 6.0, 20.0, 14.0, 16.0, 10.0, 24.0, 11.0)
val vealData = doubleArrayOf(12.0, 17.0, 21.0, 15.0, 19.0, 18.0, 13.0, 21.0, 22.0, 20.0, 5.0, 10.0)
val tomatoesData = doubleArrayOf(7.0, 30.0, 27.0, 24.0, 21.0, 15.0, 17.0, 26.0, 22.0, 28.0, 21.0, 22.0)
val cucumberData = doubleArrayOf(16.0, 10.0, 9.0, 8.0, 22.0, 14.0, 12.0, 27.0, 25.0, 23.0, 17.0, 17.0)
val pepperData = doubleArrayOf(7.0, 24.0, 21.0, 11.0, 19.0, 17.0, 14.0, 27.0, 26.0, 22.0, 28.0, 16.0)
}
}
//******************************************************************************
// SCICHART® Copyright SciChart Ltd. 2011-2021. All rights reserved.
//
// Web: http://www.scichart.com
// Support: support@scichart.com
// Sales: sales@scichart.com
//
// StackedColumnChartFragment.java is part of SCICHART®, High Performance Scientific Charts
// For full terms and conditions of the license, see http://www.scichart.com/scichart-eula/
//
// This source code is protected by international copyright law. Unauthorized
// reproduction, reverse-engineering, or distribution of all or any portion of
// this source code is strictly prohibited.
//
// This source code contains confidential and proprietary trade secrets of
// SciChart Ltd., and should at no time be copied, transferred, sold,
// distributed or made available without express written permission.
//******************************************************************************
package com.scichart.examples.fragments.examples2d.multiChart;
import android.view.animation.DecelerateInterpolator;
import androidx.annotation.NonNull;
import com.scichart.charting.model.dataSeries.IXyDataSeries;
import com.scichart.charting.modifiers.RolloverModifier;
import com.scichart.charting.modifiers.ZoomExtentsModifier;
import com.scichart.charting.visuals.SciChartSurface;
import com.scichart.charting.visuals.renderableSeries.HorizontallyStackedColumnsCollection;
import com.scichart.charting.visuals.renderableSeries.StackedColumnRenderableSeries;
import com.scichart.charting.visuals.renderableSeries.VerticallyStackedColumnsCollection;
import com.scichart.core.framework.UpdateSuspender;
import com.scichart.examples.fragments.base.ExampleSingleChartBaseFragment;
import java.util.Collections;
public class StackedColumnChartFragment extends ExampleSingleChartBaseFragment {
@Override
protected void initExample(@NonNull SciChartSurface surface) {
double[] porkData = new double[]{10, 13, 7, 16, 4, 6, 20, 14, 16, 10, 24, 11};
double[] vealData = new double[]{12, 17, 21, 15, 19, 18, 13, 21, 22, 20, 5, 10};
double[] tomatoesData = new double[]{7, 30, 27, 24, 21, 15, 17, 26, 22, 28, 21, 22};
double[] cucumberData = new double[]{16, 10, 9, 8, 22, 14, 12, 27, 25, 23, 17, 17};
double[] pepperData = new double[]{7, 24, 21, 11, 19, 17, 14, 27, 26, 22, 28, 16};
final IXyDataSeries<Double, Double> ds1 = sciChartBuilder.newXyDataSeries(Double.class, Double.class).withSeriesName("Pork Series").build();
final IXyDataSeries<Double, Double> ds2 = sciChartBuilder.newXyDataSeries(Double.class, Double.class).withSeriesName("Veal Series").build();
final IXyDataSeries<Double, Double> ds3 = sciChartBuilder.newXyDataSeries(Double.class, Double.class).withSeriesName("Tomato Series").build();
final IXyDataSeries<Double, Double> ds4 = sciChartBuilder.newXyDataSeries(Double.class, Double.class).withSeriesName("Cucumber Series").build();
final IXyDataSeries<Double, Double> ds5 = sciChartBuilder.newXyDataSeries(Double.class, Double.class).withSeriesName("Pepper Series").build();
final int initialDate = 1992;
for (int i = 0; i < porkData.length; i++) {
double xValue = initialDate + i;
ds1.append(xValue, porkData[i]);
ds2.append(xValue, vealData[i]);
ds3.append(xValue, tomatoesData[i]);
ds4.append(xValue, cucumberData[i]);
ds5.append(xValue, pepperData[i]);
}
final StackedColumnRenderableSeries porkSeries = sciChartBuilder.newStackedColumn().withDataSeries(ds1).withFillColor(0xff226fb7).withStrokeStyle(0xff22579D, 0f).build();
final StackedColumnRenderableSeries vealSeries = sciChartBuilder.newStackedColumn().withDataSeries(ds2).withFillColor(0xffff9a2e).withStrokeStyle(0xffBE642D, 0f).build();
final StackedColumnRenderableSeries tomatoSeries = sciChartBuilder.newStackedColumn().withDataSeries(ds3).withFillColor(0xffdc443f).withStrokeStyle(0xffA33631, 0f).build();
final StackedColumnRenderableSeries cucumberSeries = sciChartBuilder.newStackedColumn().withDataSeries(ds4).withFillColor(0xffaad34f).withStrokeStyle(0xff73953D, 0f).build();
final StackedColumnRenderableSeries pepperSeries = sciChartBuilder.newStackedColumn().withDataSeries(ds5).withFillColor(0xff8562b4).withStrokeStyle(0xff64458A, 0f).build();
final VerticallyStackedColumnsCollection verticalCollection1 = new VerticallyStackedColumnsCollection();
verticalCollection1.add(porkSeries);
verticalCollection1.add(vealSeries);
final VerticallyStackedColumnsCollection verticalCollection2 = new VerticallyStackedColumnsCollection();
verticalCollection2.add(tomatoSeries);
verticalCollection2.add(cucumberSeries);
verticalCollection2.add(pepperSeries);
final HorizontallyStackedColumnsCollection columnsCollection = new HorizontallyStackedColumnsCollection();
columnsCollection.setSpacing(0f);
columnsCollection.add(verticalCollection1);
columnsCollection.add(verticalCollection2);
UpdateSuspender.using(surface, () -> {
Collections.addAll(surface.getRenderableSeries(), columnsCollection);
Collections.addAll(surface.getXAxes(), sciChartBuilder.newNumericAxis().build());
Collections.addAll(surface.getYAxes(), sciChartBuilder.newNumericAxis().build());
Collections.addAll(surface.getChartModifiers(), new RolloverModifier());
Collections.addAll(surface.getChartModifiers(), new ZoomExtentsModifier());
sciChartBuilder.newAnimator(porkSeries).withWaveTransformation().withInterpolator(new DecelerateInterpolator()).withDuration(3000).withStartDelay(350).start();
sciChartBuilder.newAnimator(vealSeries).withWaveTransformation().withInterpolator(new DecelerateInterpolator()).withDuration(3000).withStartDelay(350).start();
sciChartBuilder.newAnimator(tomatoSeries).withWaveTransformation().withInterpolator(new DecelerateInterpolator()).withDuration(3000).withStartDelay(350).start();
sciChartBuilder.newAnimator(cucumberSeries).withWaveTransformation().withInterpolator(new DecelerateInterpolator()).withDuration(3000).withStartDelay(350).start();
sciChartBuilder.newAnimator(pepperSeries).withWaveTransformation().withInterpolator(new DecelerateInterpolator()).withDuration(3000).withStartDelay(350).start();
});
}
}