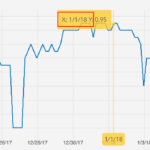
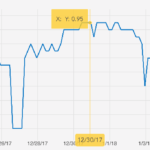
Using custom label provider I am able to format the cursor label, but still there is the name of the axis. I only want to show the value here, like “0,91” and remove the “X:” (see attached screenshots).
Thanks in advance.
override func formatCursorLabel(_ dataValue: SCIGenericType) -> String! {
    return "" // super.formatCursorLabel(dataValue)
}
- Christoph Rehbichler asked 7 years ago
- last edited 7 years ago
- You must login to post comments
Hi Christoph,
We are in the process of upgrading our iOS Chart documentation to show you how to do things like this. When completed, this will be found here.
Until then, we have a source-code example on customizing the iOS Chart Rollover.
Please head to the SciChart.iOS.Examples Github repository.
Under v2.x -> Sandbox -> SciChart_BoilerPlate_Swift_customTooltipDataView there is a sample how to change the tooltip view.
1.) You need to inherit SCIFastLineRenderableSeries
class CustomLineSeries : SCIFastLineRenderableSeries {
    override func toSeriesInfo(withHitTest info: SCIHitTestInfo) -> SCISeriesInfo! {
        return CustomSeriesInfo(series: self, hitTest: info)
    }
}
2.) As you can see the line series is returning a CustomSeriesInfo when the function toSeriesInfo is called. This is called when the tooltip is shown
class CustomSeriesInfo : SCIXySeriesInfo {
    override func createDataSeriesView() -> SCITooltipDataView! {
        let view : CustomSeriesDataView = CustomSeriesDataView.createInstance() as! CustomSeriesDataView
        view.setData(self)
        return view;
    }
}
3.) This Series Info returns our custom view which is defined in a XIB file. You can set anything on this view.
class CustomSeriesDataView : SCIXySeriesDataView {

    static override func createInstance() -> SCITooltipDataView! {
        let view : CustomSeriesDataView = (Bundle.main.loadNibNamed("CustomSeriesDataView", owner: nil, options: nil)![0] as? CustomSeriesDataView)!
        view.translatesAutoresizingMaskIntoConstraints = false
        return view
    }

    override func setData(_ data: SCISeriesInfo!) {
        let series : SCIRenderableSeriesProtocol = data.renderableSeries()

        let xAxis = series.xAxis
        let yAxis = series.yAxis

        self.nameLabel.text = data.seriesName()

        var xFormattedValue : String? = data.fortmatterdValue(fromSeriesInfo: data.xValue(), for: series.dataSeries.xType())
        if (xFormattedValue == nil) {
            xFormattedValue = xAxis?.formatCursorText(data.xValue())
        }

        var yFormattedValue : String? = data.fortmatterdValue(fromSeriesInfo: data.yValue(), for: series.dataSeries.yType())
        if (yFormattedValue == nil) {
            yFormattedValue = yAxis?.formatCursorText(data.yValue())
        }

        self.dataLabel.text = String(format: "Custom-X: %@ Custom-Y %@", xFormattedValue!, yFormattedValue!)

        self.invalidateIntrinsicContentSize()
    }
}
Please let me know if this example helps. If you have any questions just ask!
Best regards,
Andrew
- Andrew Burnett-Thompson answered 7 years ago
- You must login to post comments
Thank you for this example, Andrew! I was able to customise it as desired.
Looking forward to your updated documentation!
- Christoph Rehbichler answered 7 years ago
 Cool, glad to be of help!
- You must login to post comments
Please login first to submit.


