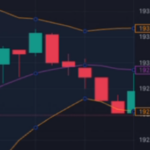
I’m trying to add a axis label/marker to the yAxis of my chart.
This label should follow the intersection between a FastLineRenderableSeries (that i’m using to render a moving average filtered dataSeries) and the yAxis.
I tried to extend the “draw” method of the FastLineRenderableSeries to draw a label ontop of the yAXis, using the “drawModifiersAxisLabel” helper function. Like:
class CustomFastLineRenderableSeries extends FastLineRenderableSeries {
draw(renderContext: WebGlRenderContext2D, renderPassData: RenderPassData) {
    super.draw(renderContext, renderPassData)
    const yAxis = getYAxis(this.parentSurface);
    drawModifiersAxisLabel(
        yAxis,
        renderContext,
        150, // testing values
        "#00ff00", // testing values
        "#00ff00", // testing values
    );
}
but the label don’t get drawn.
The attached image shows the desired feature (image from another charting lib)
How can I implement this?
- Lucas Lucafó asked 11 months ago
- You must login to post comments
Hi Lucas
This has been asked and answered before, here:
https://www.scichart.com/questions/js/price-indicators-on-yaxis
Please upvote if it helps you!
I also recommend upgrading to v3.2 as we’ve fixed some memory issues
Best regards
Andrew
- Andrew Burnett-Thompson answered 11 months ago
- last edited 11 months ago
- You must login to post comments
Please login first to submit.

