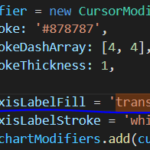
I’m trying to have a transparent axisLabelFill for my yAxis and a black axisLabelFill for my xAxis. How can I achieve that?
- Eliezer Veras asked 2 years ago
- You must login to post comments
Added xAxisLabelFill, yAxisLabelFill and xAxisLabelStroke, yAxisLabelStroke in 2.0.2185 release
- Vladyslav Bykov answered 2 years ago
- You must login to post comments
They! Thanks so much for adding this feature. But the feature has a small bug. I guess it should be easy to fix.
I attached a file with the name “bug.PNG” that tells what’s happening.
- Eliezer Veras answered 2 years ago
- You must login to post comments
Hi Eliezer,
The bug with incorrect options for scichart.js CursorModifier axis labels was fixed in version 2.0.2186
Best regards,
Michael
- Michael Klishevich answered 2 years ago
- You must login to post comments
Please login first to submit.


