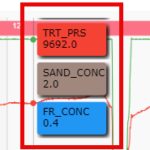
The chart is only showing 3 of 4 Tooltips, is there a way to avoid this?
- Jhonatan Laguna asked 3 months ago
- You must login to post comments
Hi Jhonatan,
I’m assuming this is a small chart, and the number of tooltips from RolloverModifier are getting clipped at the chart top and bottom.
Note: RolloverModifier cannot draw outside its chart bounds.
Perhaps what you need is a single combined tooltip. Or to reformat the tooltip container
Instead of having this for each tooltip item:
%Series_Name%
%Value%
You could have this
%Series_Name, %Value$
To find out how to template the Rollover Tooltip contents, see this documentation page
Customizing the Tooltip Content
The Tooltip Content can be customised in theRolloverModifier. There are two levels of this. You can customise just the content for the tooltip, or you can supply your own svg to customise the appearance as well.To customise the content, create a
tooltipDataTemplate. This is a function which takes aseriesInfo(which is the results of the hit-test) and returns an array of strings which are the lines that will appear in the tooltip.
e.g. some code like this:
const tooltipDataTemplate: TRolloverTooltipDataTemplate = (seriesInfo: XySeriesInfo): string[] => {
    const valuesWithLabels: string[] = [];
    valuesWithLabels.push(`${seriesInfo.seriesName}: ${seriesInfo.formattedYValue}`);
    return valuesWithLabels;
};
renderableSeries.rolloverModifierProps.tooltipDataTemplate = tooltipDataTemplate;
will return all the information for a tooltip on a single line of text.
If you require further support on this, I suggest opening a support ticket and uploading code to reproduce the problem. Our team can discuss and come back with a solution.
- Andrew Burnett-Thompson answered 3 months ago
- You must login to post comments
Please login first to submit.

