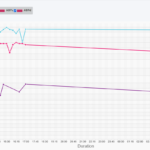
The scichart y axis is displayed as undefined after updating the data in timed interval. The y axis initially shows the value,but after the data is appended to the source, the y axis is shown as undefined in the chart.
I have attached the final scichart image with yaxis as undefined.
- Leo Leslin asked 1 year ago
- You must login to post comments
Hello, this seems to be a known issue related to axis label caching. The fix for it will be available in the next release.
A temporary solution is to disable the label caching or use the Native Text for rendering.
To do this you can use the appropriate properties on the axis: axis.useCache and axis.useNativeText,
or pass them via constructor options.
- Jim Risen answered 1 year ago
- You must login to post comments
Please login first to submit.

