Hi,
I have been struggling to print a page( xaml UserControl) containing charts and some other informations using PrintDialog. I can print but I have got issues (see the attached images)
-
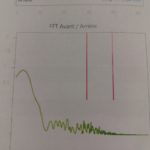
The quality of the FastLineRenderableSeries is really low (looks like blurred) even though the StrokeThickness is set to its lowest value which is 1.
-
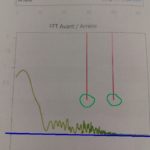
The verticalLines do not cover the entire graph (see the image) even though they are drawn correctly before printing. See on the image attached, their labels are well presented on the X axis but they dont extend to the axis.
-
The graph (FastLineRenderableSeriesis ) looks like is floating, before printing it looks all good (zoomed to extents / covering the whole frame) when printed it’s like there is a space added (all that which is below the blue line) which makes the graph look like it is floating.
I have seen in this forum some other questions and answers on how to print a graph (and only a graph) but not graphs and some other informations on a xaml page which is what I would want.
Here is the Image of the printed paper:
and the image with labels of what’s not Ok:
This is what I do to print:
PrintDialog prnt = new PrintDialog();
    if (prnt.ShowDialog() == true)
    {
        Size pageSize = new Size(prnt.PrintableAreaWidth , prnt.PrintableAreaHeight );
        MyUserControl.Measure(pageSize);
        PrntFrm.Arrange(new Rect(0, 0, pageSize.Width, pageSize.Height));
        prnt.PrintVisual(MyUserControl, "Rapport");
    }
Thanks for helping.
Kilosa M.
- Kilosa Magali asked 8 years ago
Do you have any examples for printing and screenshots when using a multi-pane chart using a SciChartGroup? Our application uses multi-pane charts and needs to be able to print and create screen captures of these as a single unit.
- David Hansen asked 9 years ago
- last active 9 years ago
I get the following exception:
{System.InvalidOperationException: Cannot set a property on object ‘System.Windows.Media.LinearGradientBrush’ because it is in a read-only state.
Other themes print fine, like BrightSpark. I guess Chrome has a problem because of its gradient background. I plan on using BrightSpark, so this is not a problem for me.
Here is the code I used:
        private void PrintMenuItem_Click(object sender, RoutedEventArgs e)
    {
        var dialog = new PrintDialog();
        if (dialog.ShowDialog() == true)
        {
            dialog.PrintVisual(FormationChart, "Formation Chart");
        }
    }
- Stephen Painchaud asked 9 years ago
- last active 7 years ago
