Hi,
I want create a chart with:
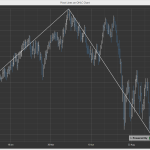
– Intraday 1 minute bar with 1 month of datas in OHLC line
– Pivots lines for each day of the months
I have 2 questions:
– What is the best renderable serie to draw the pivots line ? (I think use FastLine with IsDigital=true and XyyDataSerie)
– When I draw this chart My pivot line is concentrated at the begining (21 points) when OHLW bar take full surface (~10,000 points), why?
Thanks
- Sylvain60 asked 10 years ago
- You must login to post comments
Hi Sylvain,
I’m assuming you are using CategoryDateTimeAxis for the XAxis, am I right? If so, CategoryDateTimeAxis ignores the X date values, and uses the index of the data instead to place points on the chart. This is so that we can collapse weekends in a stock chart, for instance.
In order to place pivot lines on a candlestick chart, you have three choices:
- Is to use LineAnnotation to place the lines
- You can use FastLineRenderableSeries, but you will need to have the same number of points in all DataSeries. To achieve this, you can pad the XyDataSeries using double.NaN for a ‘null’ Y value.
-
You can create a CustomRenderableSeries to get around the restrictions above.
public class PivotLineRenderableSeries : CustomRenderableSeries
{
    protected override void Draw(IRenderContext2D renderContext, IRenderPassData renderPassData)
    {
        base.Draw(renderContext, renderPassData);

        var data = renderPassData.PointSeries;

        // This example assumes you are using the render series on a chart with CategoryCoordinateCalculator as XAxis
        var xCalc = renderPassData.XCoordinateCalculator as ICategoryCoordinateCalculator;
        var yCalc = renderPassData.YCoordinateCalculator;

        // Create a pen
        using (var pen = renderContext.CreatePen(SeriesColor, AntiAliasing, StrokeThickness))
        {
            // begin a line (NOTE: This is v3.2 line drawing API
            using (var lineContext = renderContext.BeginLine(pen,
                    GetXCoord(xCalc, (int)data.XValues[0]),
                    GetYCoord(yCalc, data.YValues[0])))
            {
                // Continue the line. Dispose completes the line
                for (int i = 1; i < data.Count; i++)
                {
                    lineContext.MoveTo(
                        GetXCoord(xCalc, (int)data.XValues[i]),
                        GetYCoord(yCalc, data.YValues[i]));
                }
            }
        }
    }

    private double GetXCoord(ICategoryCoordinateCalculator xCalc, int index)
    {
        // Instead of calling xCalc.GetCoordinate(index), which will return the coordinates for indices 0, 1, 2, 3
        // (as there are only 4 points in the XyDataSeries)
        //
        // we call xCalc.TransformDataToIndex, to get the Index on the axis corresponding to the Date values in the XyDataSeries
        //
        // This can then be used to get the coordinate for the screen.
        var originalDate = DataSeries.XValues[index];
        int transformedIndex = xCalc.TransformDataToIndex((DateTime)originalDate);
        return xCalc.GetCoordinate(transformedIndex);
    }

    private double GetYCoord(ICoordinateCalculator<double> yCalc, double xValue)
    {
        return yCalc.GetCoordinate(xValue);
    }
}
And example of use
    <!-- XAML -->
    <s:SciChartSurface>
        <s:SciChartSurface.RenderableSeries>
            <s:FastOhlcRenderableSeries x:Name="ohlcSeries"/>
            <zigZagLinesInStockCharts:PivotLineRenderableSeries x:Name="pivotSeries" StrokeThickness="2"/>
        </s:SciChartSurface.RenderableSeries>
        <s:SciChartSurface.XAxis>
            <s:CategoryDateTimeAxis/>
        </s:SciChartSurface.XAxis>
        <s:SciChartSurface.YAxis>
            <s:NumericAxis/>
        </s:SciChartSurface.YAxis>
    </s:SciChartSurface>
and code behind
    // Code behind
    public partial class ZigZagWithStockCharts : Window
    {
        public ZigZagWithStockCharts()
        {
            InitializeComponent();

            var prices = DataManager.Instance.GetPriceData("INDU_Daily");

            var ohlcDataSeries = new OhlcDataSeries<DateTime, double>();
            var xyDataSeries = new XyDataSeries<DateTime, double>();

            // Append some data to OHLC DataSeries
            ohlcDataSeries.Append(prices.TimeData, prices.OpenData, prices.HighData, prices.LowData, prices.CloseData);

            // Find the Time and Min, Max of the OHLC data
            double min = prices.LowData.Min();
            DateTime minDate = prices.TimeData[prices.LowData.IndexOf(min)];

            double max = prices.HighData.Max();
            DateTime maxDate = prices.TimeData[prices.HighData.IndexOf(max)];

            double first = prices.OpenData.First();
            DateTime firstDate = prices.TimeData.First();

            double Last = prices.CloseData.Last();
            DateTime lastDate = prices.TimeData.Last();

            // Append simply four points, Start, High, Low, Close for the entire series to the XY series. We expect to
            // see a line with 4 line segments
            xyDataSeries.Append(firstDate, first);
            xyDataSeries.Append(maxDate, max);
            xyDataSeries.Append(minDate, min);
            xyDataSeries.Append(lastDate, Last);

            ohlcSeries.DataSeries = ohlcDataSeries;
            pivotSeries.DataSeries = xyDataSeries;
        }
    }
Best regards,
Andrew
- Andrew Burnett-Thompson answered 10 years ago
- last edited 10 years ago
- You must login to post comments
Tanks andrew for your answer.
Pivot line is a horizontal line as support and resistance.
This Y value is differente for each day of the month.
I need draw 1 horizontal line by day.
But I show your sample too learn how create my custom pivot line, thanks
- Sylvain60 answered 10 years ago
 If you do come up with a solution, please post it here so others can benefit. Thanks!
- You must login to post comments
I am considering applying server-side licensing for my javerScript application.
In the document below, there is a phrase “Our server-side licensing component is written in C++.”
(https://support.scichart.com/index.php?/Knowledgebase/Article/View/17256/42/)
However, there is only asp.net sample code on the provided github.
(https://github.com/ABTSoftware/SciChart.JS.Examples/tree/master/Sandbox/demo-dotnet-server-licensing)
I wonder if there is a sample code implemented in C++ for server-side licensing.
Can you provide c++ sample code?
Also, are there any examples to run on Ubuntu?
- Sylvain60 answered 10 years ago
- You must login to post comments
Please login first to submit.

