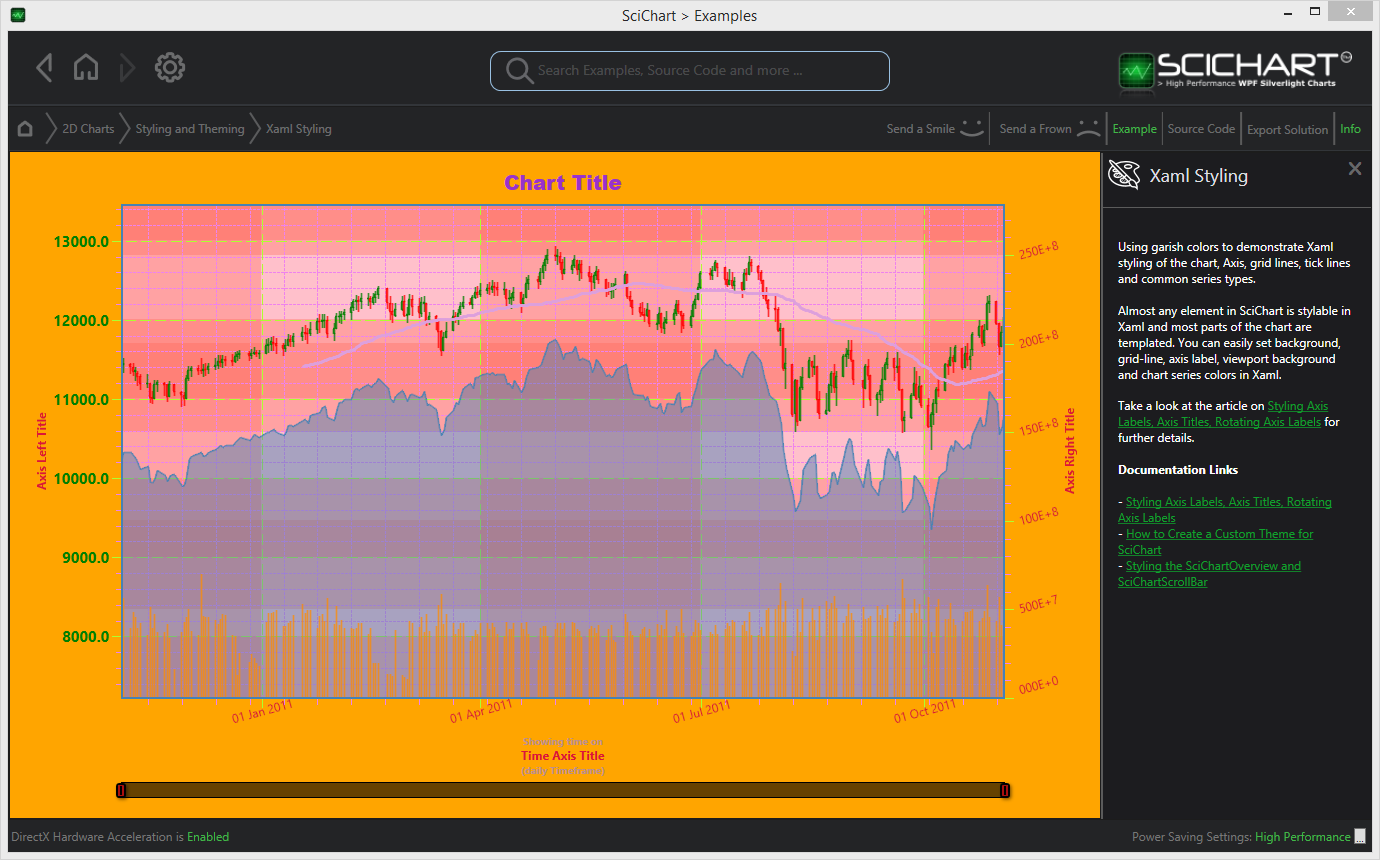
I successfully migrated my wpf project from v3 to v4 today using the upgrader tool addin for visual studio. All of my charts had previously had solid color backgrounds that changed depending on application state. This still works, but everything is overlaid with a vertical and horizontal zebra-striping, resembling a picnic blanket. I can’t seem to find the documentation for where that’s happening (currently I’m overwriting the renderable background to change the solid base color, but the striping persists) where is the documentation for that particular feature.
The v3 examples had garrish colors to help you out with the styling, but the new one has everything looking good and it’s hard to tell where in the source I should be looking.
- Neil Zumwalde asked 9 years ago
- You must login to post comments
I ran into this same issue, and it appears that the only difference is that now the X and Y axis DrawMajorBands and DrawMinorGridlines properties default to True. Setting them to False returns the chart to it’s previous appearance.
- William Stebler answered 9 years ago
 That’s absolutely right, AxisBase.DrawMajorBands is default true in SciChart v4, whereas in v3 it was default false.
- You must login to post comments
Hi Neil,
The garish-coloured Xaml Styling example is still present in the SciChart v4 Examples Suite.

The only difference between v3 and v4 in terms of styling is the default theme is now SciChartv4Dark (was previously ExpressionDark). If you haven’t set the Theme, try setting to ExpressionDark, it may resolve your issues.
I would recommend pointing WPF Snoop at your application to try to determine where colours are coming from / tweak colours.
Best regards,
Andrew
- Andrew Burnett-Thompson answered 9 years ago
- You must login to post comments
Please login first to submit.
