Hi,
I have a vertical slice modifier. Currently whenever a series has a point near the marker, a kind of tooltip is displayed showing th value of that series at that point. I want to turn off this tooltip functionality (not sure if its called AxisLabel, SeriesValue or something else).
Ive tried setting various properties but I’m still getting the tooltip. Can someone point me in the right direction :
               <s:VerticalSliceModifier  s:SeriesValueModifier.IsSeriesValueModifierEnabled="False" ShowAxisLabels="False" >
                                    <s:VerticalSliceModifier.VerticalLines>
                                        <s:VerticalLineAnnotation
                                            X1="{Binding ...}"
                                            YAxisId="DefaultYAxis"
                                            s:SeriesValueModifier.IsSeriesValueModifierEnabled="False"
                                            ShowLabel="False"
                                            />
                                    </s:VerticalSliceModifier.VerticalLines>
                                </s:VerticalSliceModifier>
- F W asked 9 years ago
- You must login to post comments
Sorry – I’m not sure what happened, but I just ran my app again with the same code and now the labels are gone. My bad :/
Cheers
felix
- F W answered 9 years ago
 Glad its sorted for you!
- You must login to post comments
Hello, SciChart Team!
I have the same issue, but I create vertical lines programmatically.
Have no idea how to make values labels disappear, here’s the code I use:
var slice = new VerticalLineAnnotation()
            {
                X1 = x,
                Name = harmonic.Name,
                YAxisId = "MainAxis",
                ShowLabel = false,
                IsEditable = false,
                Stroke = new SolidColorBrush(ColorsList[1])
            };
            sliceModifier.VerticalLines.Add(slice);
and the xaml:
<SciChart:VerticalSliceModifier x:Name="sliceModifier" SciChart:SeriesValueModifier.IsSeriesValueModifierEnabled="False" ShowAxisLabels="False" />
Could you please hint me on how to remove values labels programmatically? Or maybe i shouldn’t use VerticalLineAnnotation?
Thanks in advance!
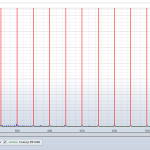
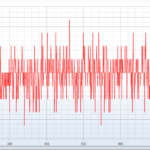
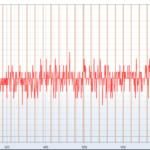
P.S. I Added a picture of what I want to get rid of (please see attachments).
Alexander.
- Alexander Volkov answered 8 years ago
- last edited 8 years ago
 Hi Alexander, the VerticalLineAnnotation.ShowLabels property shows and hides the Axis Label. There is no way to hide a tooltip from a single VerticalLineAnnotation. What exactly did you want to do and why?
 Hello, Andrew, well, I need vertical lines on chart that will represent harmonics, there are several harmonics,which repeat on some interval. I just need lines without tooltips. Is there another instrument that I can use to achieve it?
- You must login to post comments
Hello, SciChart
I have found tool which seems to do what i want, but SciChartSurface doesn’t update after i add them programmatically.
By tool i mean VerticalLineAnnotation, here’s the code:
double x = harmonic.Frequency;
        int i = 1;
        while (x < Math.Min((double)MainChartSurface.XAxes[0].DataRange.Max,10000.0))
        {
            VerticalLineAnnotation newAnn = new VerticalLineAnnotation() {
                X1 = x,
                Stroke = new SolidColorBrush(harmonic.Color),
                ShowLabel = false,
                IsEditable = false
            };
            MainChartSurface.Annotations.Add(newAnn);
            x = harmonic.Frequency * ++i;
        }
after this code runs i expect vertical lines to appear, but they don’t. they appear only when pan or zoom chart (just do something): images before and after are attached, please help me to understand what i’m missing to make surface refresh. i tried to use method “SciChartSurface.UpdateLayout();” but it didn’t help.
Thanks in advance
Alexander.
- Alexander Volkov answered 8 years ago
- last edited 8 years ago
- You must login to post comments
Please login first to submit.


