Hi,
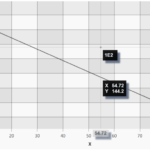
Using a tooltip with a LineSeries with an Logarithmic Y-axis, seem to give widely inaccurate results.
The series is as follows:
double[] x = new double[] { 1, 1.0e1 , 1.0e2 };
double[] y = new double[] { 615.9, 275.6197, 11.05376};
Using a CursorModifier as follows:
<s:CursorModifier ShowAxisLabels="True" UseInterpolation="True" SnappingMode="CrosshairToSeries" ShowTooltip="True"/>
The expected behaviour would be for the Crosshair to follow the curve, but for some reason it’s some way off. It looks as if it’s following Y-values which are somewhat truncated. X-values are fine for some reason.
Is there are a way to increase the resolution of the Y-values so the user gets the correct value when using a tooltip.
- Patrik Adolfsson asked 3 years ago
- You must login to post comments
Hi Patrik,
Thanks for your inquiry.
We have noticed you are using an outdated SciChart version. Please update to the current version, which is SciChart v6.3.0.13476 currently, and let us know if you still experience the issue.
You can also check this with the latest SciChart nightly build. Here is how to get it:
https://support.scichart.com/index.php?/Knowledgebase/Article/View/17232/37/getting-nightly-builds-with-nuget
Hope this helps.
With best regards,
Oleksandr
- Oleksandr Shvets answered 3 years ago
 I updated to the latest v6.3.0.13476, but the problem is still there. I also tested the nightly build v6.3.0.13542 which also has the issue.
- You must login to post comments
Please login first to submit.

