We’re working on a Nyquist plot using the latest SciChart SDK for WPF.
We have quite a MVVM dependent structure already in place.
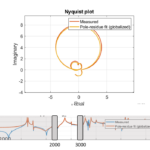
We are working with 3D frequency based Complex data. The Nyquist plot would have 2 axes – Y for Imaginary values and X axis for Real values. We apply some averaging and post-processing of the 3D data to put in 2D form and show it in the Nyquist plot.
However, we’d like to be able to scroll the data at certain frequency ranges without showing the actual frequency graph in the plot. Is there a possibility to implement an independent scrollbar containing a averaged magnitude graph (similar idea to the processing of the Nyquist data) over a frequency range? We’d like to scroll this frequency range and on selected range changed to recalculate data in the Nyquist plot.
We have quite an extensive graphing structure implemented already. The main issue I’m currently facing is that the scrollbar is bound to the SciChartSurface and I cannot seem to figure out how to build it more like a “sexy” frequency range selector while staying within the SciChart library? Is there any possibility to not be bound to the SciChartSurface? And of course, the axes are quite different – in the Nyquist we have linear real and imaginary values (-2 to +2, for example) whereas the frequency range would extend much further data-wise (0 – 3000 Hz, for example).
Any help would be appreciated. Feel free to ask for more details.
- Kaloyan Krastev asked 1 year ago
- last edited 1 year ago
- You must login to post comments
I am considering applying server-side licensing for my javerScript application.
In the document below, there is a phrase “Our server-side licensing component is written in C++.”
(https://support.scichart.com/index.php?/Knowledgebase/Article/View/17256/42/)
However, there is only asp.net sample code on the provided github.
(https://github.com/ABTSoftware/SciChart.JS.Examples/tree/master/Sandbox/demo-dotnet-server-licensing)
I wonder if there is a sample code implemented in C++ for server-side licensing.
Can you provide c++ sample code?
Also, are there any examples to run on Ubuntu?
- Andrew Burnett-Thompson answered 1 year ago
- You must login to post comments
Hi Andrew,
Thanks for the quick reply. Today I tried the approach you had suggested – adding a hidden axis and binding the SciChartScrollbar to it.
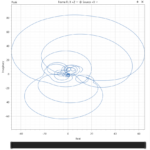
However, the result I’m getting is an irresponsive blank scrollbar (you can see the image attached). I Snooped the app and all the Bindings are correct and if I make the hidden axis visible and scroll it, the SelectedRange of the scrollbar responds.
But I cannot reset the visible range of the hidden axis to the initial one (even with set VisibleRangeLimit prop). I suppose it’s because there is no data series using the axis in the main surface? Or the data is not in the surface, in general? I did try connecting a data series to the hidden axis by Id but the result didn’t change.
Unless, I add the frequency series to the main surface, the scrollbar and hidden axis remain irresponsive. Could there be a way around this?
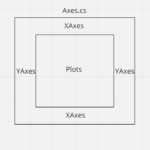
A thing I forgot to mention was that we’re building the XAML of the SciChart elements in a ResourceDictionary and bind to it using TemplateBinding through Axes.cs which then we set up using an AxesViewModel with many things inside including YAxes and XAxes collections, etc. Following the idea behind the MVVM examples.
- Kaloyan Krastev answered 1 year ago
- last edited 1 year ago
 Do you want to share the code you’ve done so far to create this? Our team can look and suggest improvements. The best way to do this since you’re a priority support customer would be to create a project to reproduce what you’ve done so far, and send it to a support ticket. Make sure you remove bin/obj folders and /packages so that the zip size is small!
- You must login to post comments
Yes, it is possible to have completely independent chart series under a scrollbar in SciChart. By creating a separate SciChartSurface for the scrollbar, you can have different chart series, data, and visualizations while still maintaining synchronization with the main chart when needed. subway surfers
Regarding the SciChartScrollBar Axis property, you are correct that it is often bound to the main chart’s XAxis to control bidirectional range control between the main chart and the scrollbar. However, in your case, you want to define a custom range for the scrollbar and receive notifications when it changes.
Your idea of binding the SciChartScrollbar to a hidden axis on the main chart and subscribing to Axis.VisibleRangeChanged on that hidden axis is a valid approach to achieve the desired functionality.
- Andree Oren answered 1 year ago
- last edited 5 months ago
- You must login to post comments
Please login first to submit.


