Hi,
NOTE: Still using Scichart 1.7 here…
I have two questions about the rollovermodifier behaviour:
-
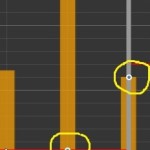
As you can see in the picture, when rolling over the chart, sometimes the Xvalues of the series are not aligned. Is it possible to force this to be the same? Basically i always want the Xvalue to be the same for all the series when rolling over, would be nice to have the xvalue where the vertical bar is shown…

-
Might be just the chart behaviour, but is it possible to have the rollover feedback performed for values not in the visible range? When zoomed in, and for instance the top of the columnBar is not within the range, the seriesinfo is not shown for this datapoint.
Thanks a lot for the feedback.
- Robert Post asked 9 years ago
- last edited 9 years ago
- You must login to post comments
Hi Robert,
The RolloverModifier does expect that all the series have the same X-Values. This is because it’s designed to cut a line through a time-series. Series with different values have to be interpolated which adds to the performance overhead.
There is a property in the RolloverModifier: UseInterpolation, which performs interpolation and places markers between data-points, however, it will only really make sense for line or mountain charts, not for column charts.
Finally, we can’t make any code changes in v1.7 as we no longer support this version, but, if you see a problem in the latest version (v3.4) then we will be happy to address it!
Best regards,
Andrew
- Andrew Burnett-Thompson answered 9 years ago
- You must login to post comments
Hi Andrew,
Thanks for your message.
To clarify: In my version of SciChart, is it possible to get back the same xvalues for all the series or not? Please see the attached image. In there you will see that the rollover feedback is not the same for all the series (this probably has to do with column vs. line series).
- Robert Post answered 9 years ago
- You must login to post comments
Please login first to submit.
