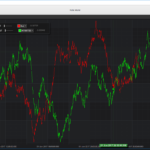
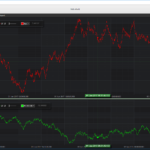
I have two charts (separate SciChartSurface via SciChartGroup) stacked on top of each other. Each chart has its own X-Axis and both charts’ mouse interaction are linked via MouseGroupId. All fine so far.
I then generate a lineseries ‘series1’ on the first surface, 1000 datapoints, time stamps are 1 minute apart. I also generate a second line series ‘series2′ on the second surface, but this series’ first time timestamp start 2 hours later than the first series.
Expected behavior is that the series2 will be shifted by 2 hours and not start at the same position as series1 but rather extend by 2 hours. That is, however, not the case on my chart.
What is wrong here and is this a potential bug?
I need both XAxes to be perfectly aligned, meaning the cross hair label on each XAxis displays the exact same time stamp. Please note that I customized the LabelProvider to display milliseconds also, but I use the same Label Provider for both charts, so no difference here.
Can someone please chime in what is going on?
Please see attached charts to illustrate what I have been describing (screenshot1 shows intended behavior but on the same chart, I want this behavior to occur on separate panes/charts). Screenshot 2 describes the problem I am having.
Thanks
- bbmat asked 7 years ago
- last edited 7 years ago
- You must login to post comments
Hi there,
How have you synchronised the two charts?
In our documentation we demonstrate you need to set MouseManager.MouseEventGroup to share the events, and also bind XAxis.VisibleRange TwoWay to a common view model property.
For more info please see the tutorial: Synchronizing Multiple Charts.
Let me know if this helps,
Best regards,
Andrew
- Andrew Burnett-Thompson answered 7 years ago
 Problem solved, somehow using the ViewportManager solved the problem. The sync issue went away only after binding to ViewportManager. I synced via VerticalChartGroup and a shared X-Axis. I also shared mouse interaction via MouseEventGroup. Only adding ViewportManager solved the offset on the x-Axis between the different chart panes.
- You must login to post comments
Second suggestion. Are you using CategoryDateTimeAxis?
If YES then this axis type expects both series to have the same number of data-points. One way you can solve this is to pad the data-series with Y=Double.NaN before data starts. Another way is to use DateTimeAxis, or … in v5 the upcoming DiscontinuousDateTimeAxis.
Best regards,
Andrew
- Andrew Burnett-Thompson answered 7 years ago
 I used a CategoryDateTimeAxis (and read already that the number data-points must be identical to achieve synchronicity between different chart panes and their respective series). As the padding seems the only solution but was quite time consuming when adding series with many hundreds of thousands of datapoints I reverted back to a DateTime Axis.
- You must login to post comments
Please login first to submit.


