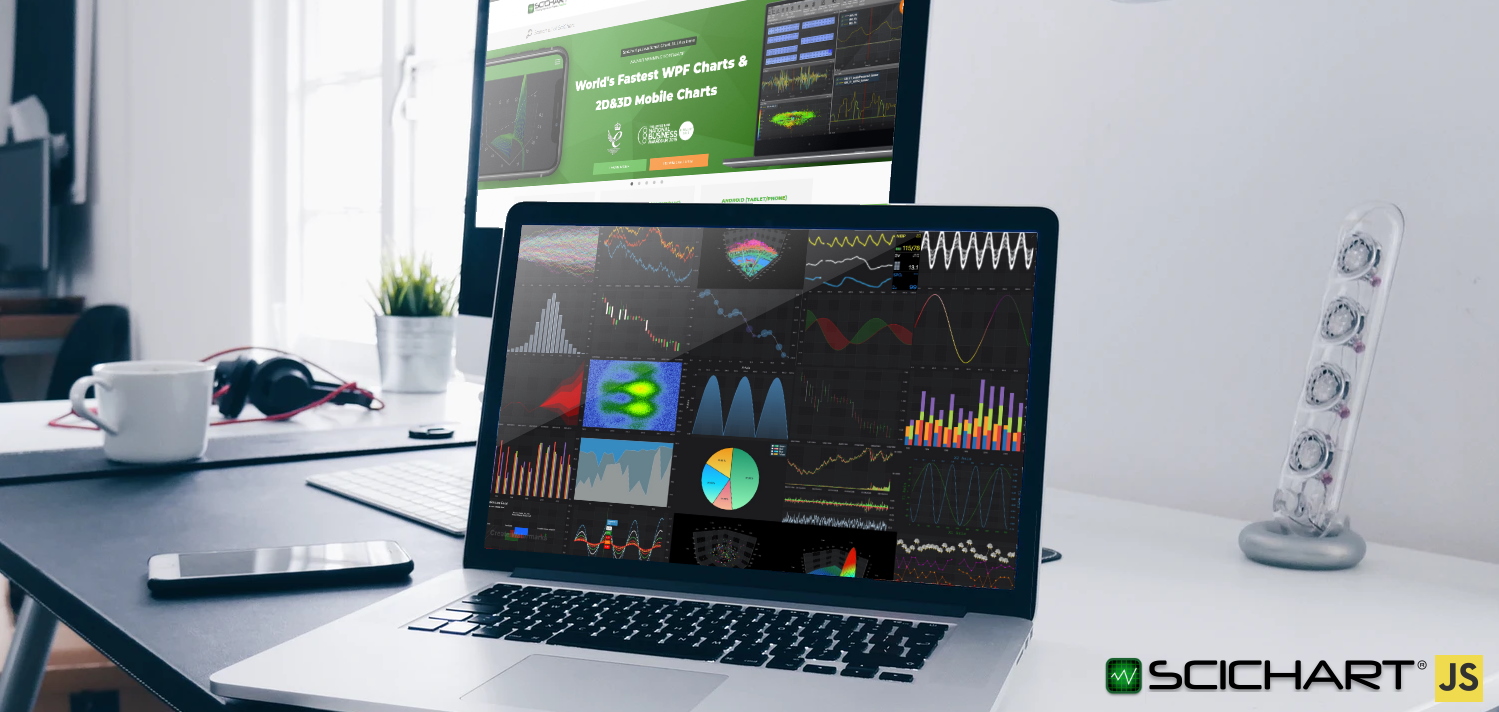
At SciChart we focus on creating the world’s fastest, and best chart components across platforms. Our award-winning software has already been considered the best in class for WPF (Windows) and mobile, and our goal for SciChart.js is exactly the same – to make this the world’s best, most flexible and powerful charting & data-visualization toolkit for JavaScript apps.
What has made us great in the past is customer feedback. We have a really loyal customer-base who in the past has not been shy about giving us feedback: both positive and negative. We like to follow customer-driven-development to ensure that we are creating the most valuable products and features for your applications.
With that in mind I would to share with you our plans & roadmap for SciChart.js in 2021, but also to get your feedback on what features you would like to see, what bugs or issues annoy you and how best we can improve.
Let’s start with the roadmap below!
SciChart.js 2021 Roadmap
SciChart.js was released in November 2020. The World’s Fastest Javascript chart component, powered by our award winning cross-platform Visual Xccelerator engine using cutting-edge technologies WebAssembly, WebGL. This is what we’ve added so far to the library and what we plan to add in the future.
November 2020: SciChart.js 1.0
- The first version featured many chart types including Line, Scatter, Bubble, Column, Candlestick, Ohlc, Mountain, Area, Band, Fan, Heatmap, Stacked Column, Stacked Mountain, Pie, Donut, 3D Bubble Chart, 3D Surface Mesh chart.
- Extreme realtime or Big-data performance
- Zooming, panning, scaling interactions via the ChartModifier API
- Unlimited X,Y axis, linking multiple charts
- Basic annotations
- Themes
Read more in the release note here: SciChart.js 1.0 Released
December 2020: SciChart.js 1.1
- Added Browser Global module support via a <script/> hosted on CDN. No longer must you use npm, although we recommend it!
- Complete set of video and written tutorials
- Added Test domain / hostname licensing
- Added more examples including contours, creating annotations on mouse-click, heatmaps in vertical charts, data-point selection, animating Xy values, realtime zooming and panning, 1-million point demo
- Added various boilerplate examples to our Github including React, Create-react-app, Angular, Vue.js and more
- Various bug fixes and improvements.
Read more in the release note here: SciChart.js 1.1 Released
Feb 2021: SciChart.js 1.2
- Added new annotation types: HorizontalLineAnnotation, VerticalLineAnnotation, AxisMarkerAnnotation.
- Made Annotations editable, allowing select click and drag via the mouse
- Added Digital Line charts, Digital or Step mountain, Digital Band
- Added styling borders and padding/margin around the chart and axis.
- Added a MS Blazor boilerplate example to our Github.
- Various bug fixes and improvements
Read more at the release note below: SciChart.js 1.2 Released
March 2021: SciChart.js 1.3
We are about to release another update to SciChart.js, version 1.3. This contains some excellent features and improvements and we will be publishing this shortly.
Features COMING SOON include:
- Spline line (smoothed line) chart type
- Spline mountain (smoothed mountain) chart type
- Spline Band (smoothed band) chart type
- Dashed line styling.
- Series animations, including opacity (fade), sweep, wave and scale which are featured in our other platforms (WPF, iOS, Android, macOS).
- Various bug fixes and improvements including performance issues, a memory leak and other issues reported by our users.
Q2-Q3 Roadmap
So what next? That depends entirely on you, our userbase. You need to tell us what you want to see us build! We have been collecting feedback and already have these features on our roadmap.
Features in WPF/iOS/Android SciChart which are being ported to Js soon:
- PointMetadata feature. Ability to tag data points with objects which can be consumed in tooltips.
- CustomRenderableSeries feature.
- Vertically Stacked Axis feature.
- Central X,Y Axis Feature
- Composite Annotation feature
- More chart types
- More examples, demos and showcases
Finally we’re also redesigning the SciChart.js Examples App. This is going to look considerably better and be more usable. It will also help us as we add many more examples (we plan to add hundreds).
SciChart.js Features Survey
So there’s plenty on our roadmap but we’d love to hear from you what is most important? What do you want to see us build in SciChart.js? What would make you become a customer (if not already)?
We’ve created a simple SciChart.js Features survey with where you can tell us your features. It should only take a few minutes to fill out. If you want to see something in SciChart.js then please tell us below! These are going to get reviewed and fed back into our roadmap so we can create the most valuable, most useful products for your projects.
Thank you in advance for your time and we look forward to hearing from you!
Best regards,
Andrew
[SciChart Team]
Related Posts
