SciChart for Avalonia XPF v2.0 Released!
SciChart is thrilled to announce the release of SciChart for Avalonia XPF 2.0 – a major update that brings all features and improvements […]
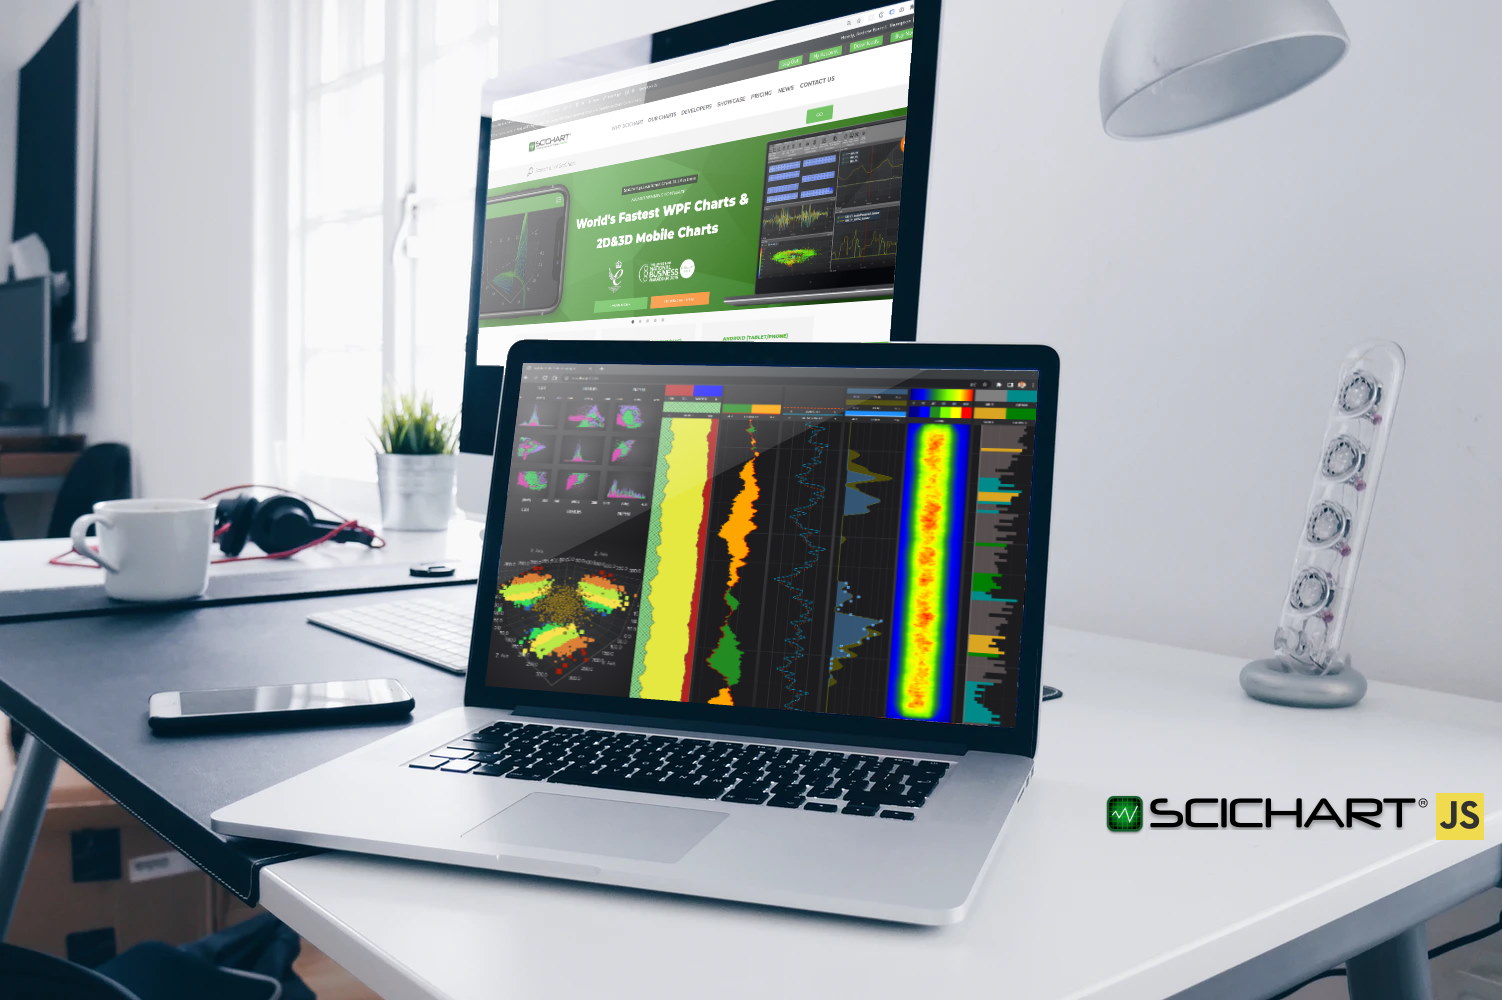
We are pleased to announce that the SciChart.js v2.2 build 2378 has now been released!
This backward-compatible update includes a number of new features, improvements and bug-fixes.
This release is a drop-in replacement and it is backward compatible for users of SciChart.js version 2.
We created an awesome Oil & Gas dashboard demo. Designed to show the capabilities of SciChart.js for oil & gas explorers, we created a JavaScript dashboard which includes vertical charts with multiple visualisation types, trellis charts, 3d charts used in the energy sector.
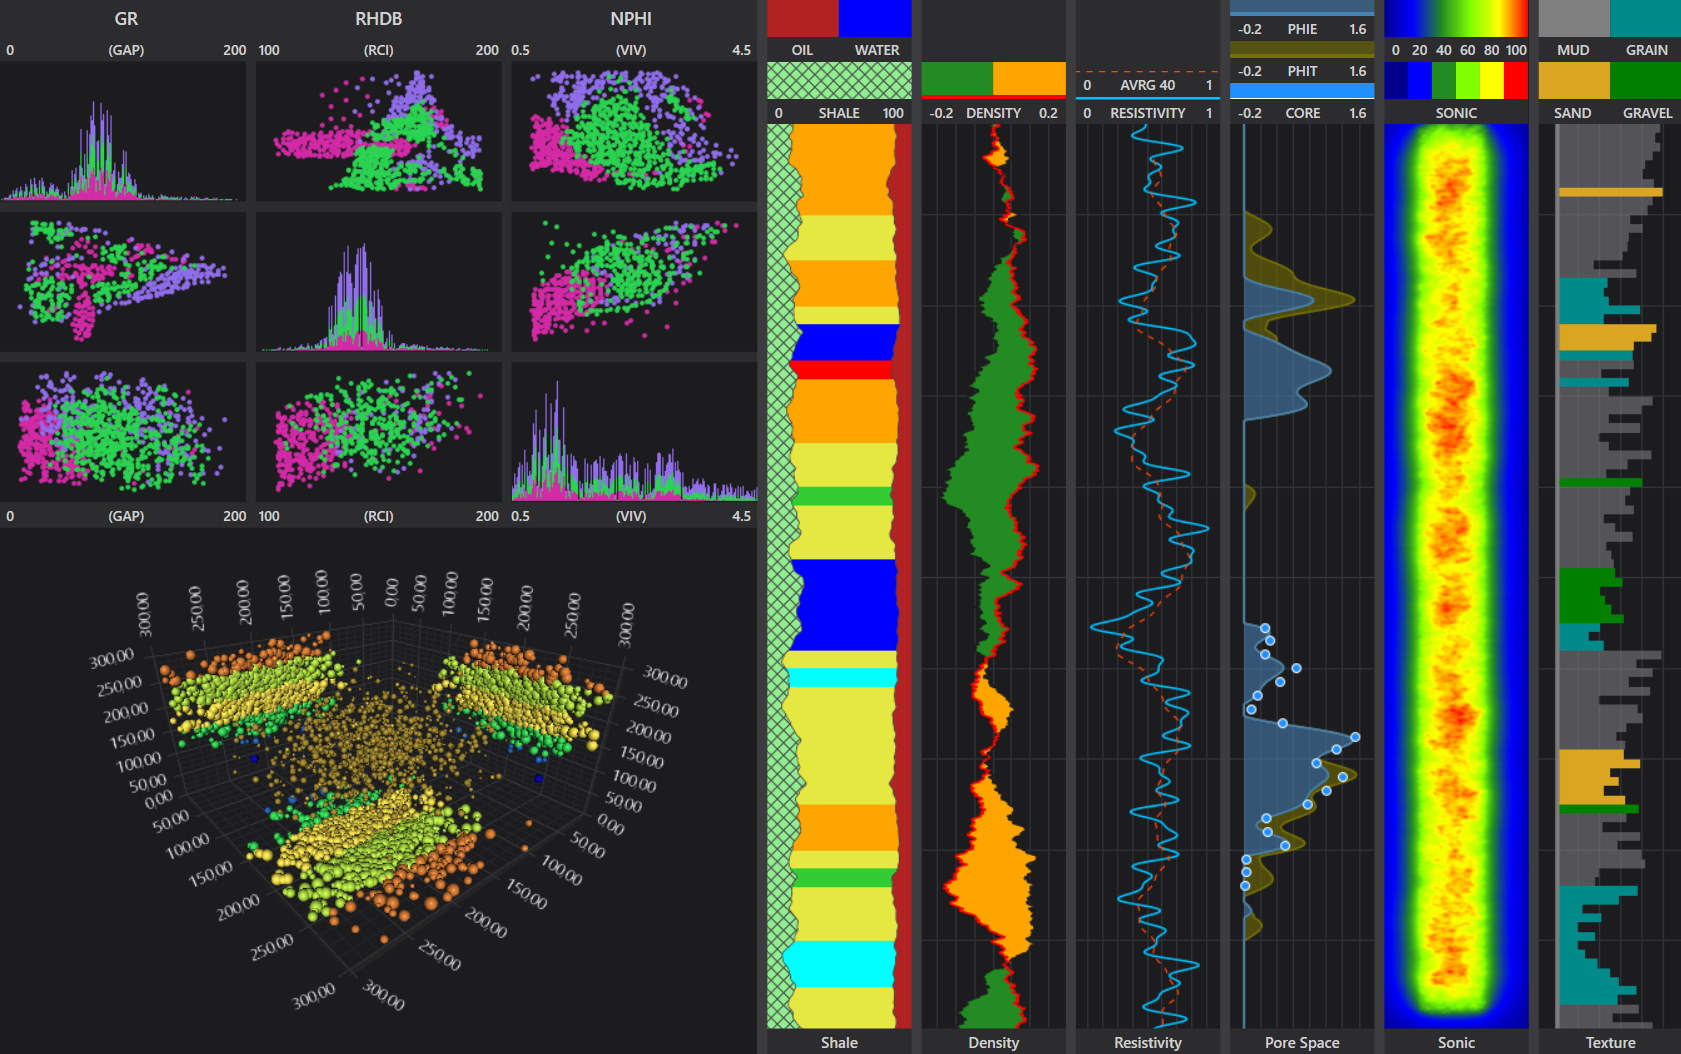
We’ve created some demos with source-code showing how you can configure SciChart for Oil & Gas applications below. These have been created in both JavaScript for browser apps and WPF / C# for Windows desktop apps.
You can find a blog post of the Oil & Gas demo with source-code in both WPF and JavaScript above.
We call this an Impulse Chart, but another name is Stem Chart or Lollipop Chart. This chart type is a thin stem with a pointmarker at the top. Common when visualising trends, or in pharmaceutical, scientific and electronics industries.
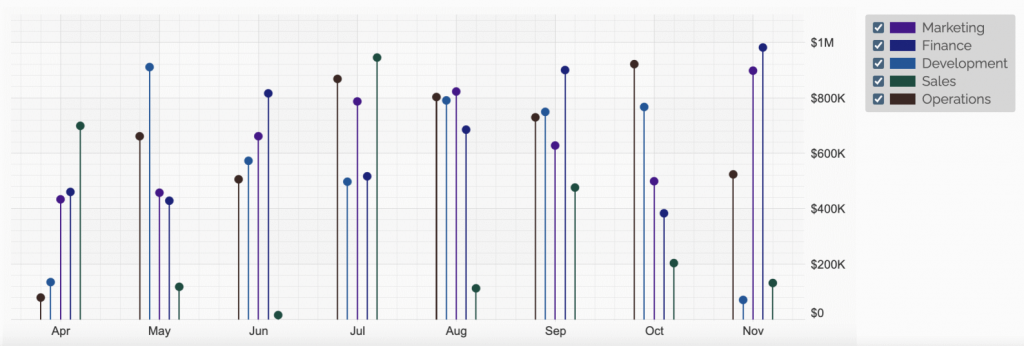
You can find a demo of the Lollipop Chart here, and documentation here.
Error Bars were a hot feature-request and are now in the SciChart.js library v2.2 and above. Error values can be set per-datapoint and can be styled and sized according to available space or by exact pixel amounts. Error bars can be set horizontally, vertically or both and work on linear and logarithmic axis.
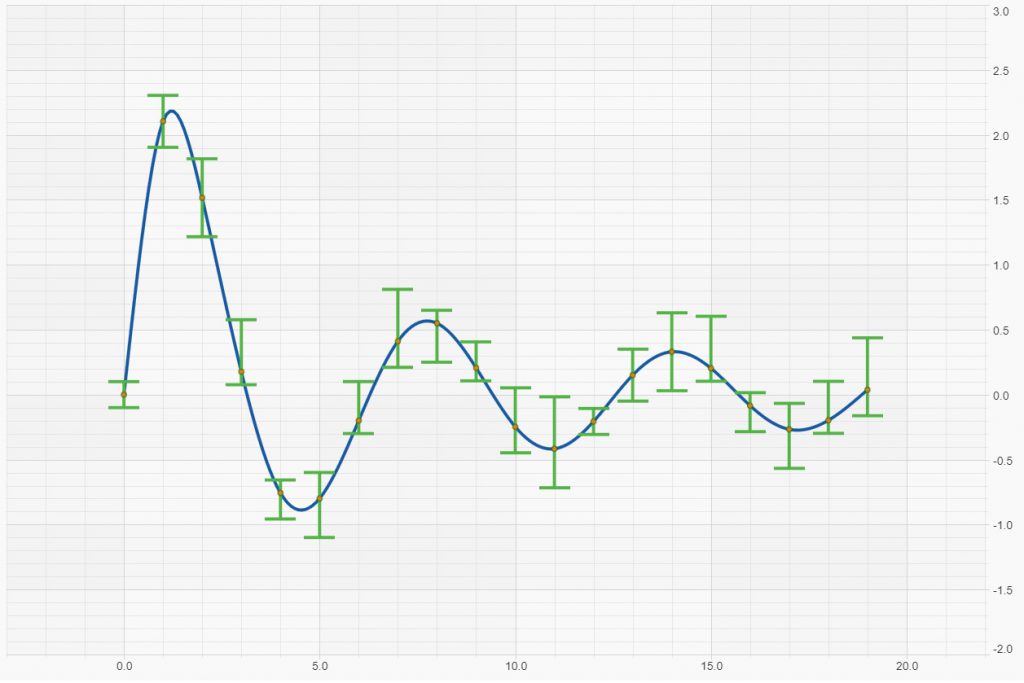
You can find a demo of the Error Bars Chart here, and documentation here.
One of our customers pointed out that Pie Charts could not be updated. So we added updates, but we also added animated updates!
To enable animated updates, set the SciChartPieSurface.animate property = true and then update the PieSegment.value properties.

You can find a demo of the Pie Chart here, and documentation here
The self same customer (if you don’t ask you don’t get) also requested label customisation. So we added various ways to customize pie chart and donut chart labels.
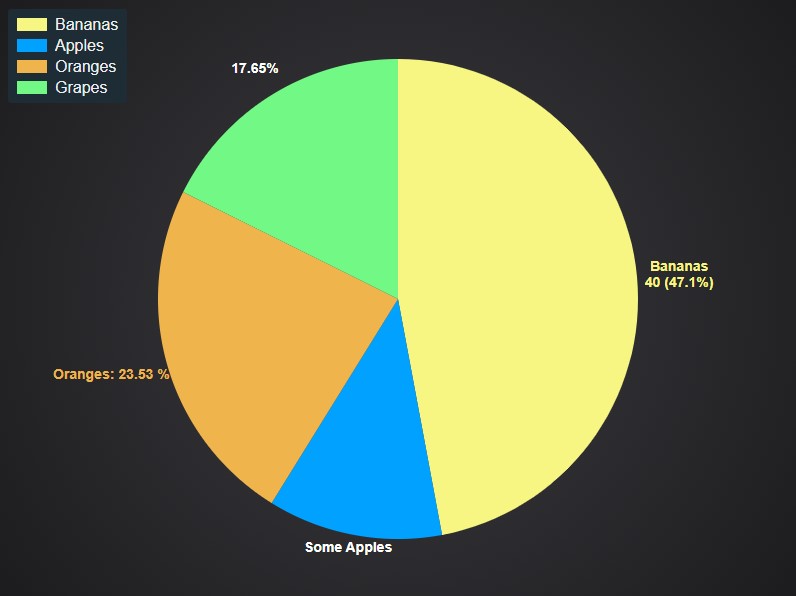
You can find a demo of the Pie Chart here, and documentation here
While building the Oil & Gas dashboard demo, we discovered Stacked Mountain series did not support Paletteprovider – the API feature where you can colour segments of the chart programmatically. So we’ve added this.
You can find a demo of StackedMountain Paletting and code sample here.
A customer requested (you don’t ask don’t get!) if SciChart.js can draw the series behind axis. Answer is, by setting this new flag, yes!
const { sciChartSurface, wasmContext } = await SciChartSurface.create(divElementId);
// Allows to use all existing space for drawing
sciChartSurface.drawSeriesBehindAxis = true;
You can find a demo of drawing series behind axis here, and documentation here.
The same customer asked if we could add a background colour to axis. You asked, we delivered!
// Set the axis background color
const yAxis = new NumericAxis(wasmContext, {
    axisTitleStyle: { color: "#368BC1" },
    axisTitle: "Y Axis",
    axisBorder: {
        borderLeft: 1,
        color: "#368BC1" // Blue color
    },
    backgroundColor: "#368BC111"
});
See the Axis Styling documentation here.
We’ve added the ability to place a tooltip (such as RolloverModifier) outside the chart area. To do this set the divElement ID on the RolloverModifier properties.
// Set the Div ID for rollover tooltips
new RolloverModifier({ placementDivId: "my-tooltip-div-id" });
See the RolloverModifier Documentation here.
We’ve added two features to allow you to be notified when a legend item is clicked or when a series.isVisible property changes.
import { FastLineRenderableSeries } from "scichart/Charting/Visuals/RenderableSeries/FastLineRenderableSeries";

// Subscribe to onIsVisibleChanged on instantiation
const lineSeries = new FastLineRenderableSeries(wasmContext, {
    stroke: "Red",
    strokeThickness: 3,
    isVisible: true,
    onIsVisibleChanged: (sourceSeries, isVisible) => {
        console.log(`Series ${sourceSeries.type} was set to isVisible=${isVisible}`);
    }
});
// Alternatiely you can subscribe to (or unsubscribe from) isVisibleChanged after instantiation
lineSeries.isVisibleChanged.subscribe((sourceSeries, isVisible) => {
    console.log(`Option 2: Series ${sourceSeries.type} was set to isVisible=${isVisible}`);
});
See the documentation for series visibility callbacks, and legend item checked-changed callback.
Packaging Webassembly (wasm) files with your application can be tricky. We’ve provided methods to do this in a number of apps (like React, Angular etc) but sometimes the simplest method is just load and download it from a CDN.
import {SciChartSurface} from "scichart/Charting/Visuals/SciChartSurface";

export async function initSciChart() {
    // Call this once before any SciChartSurface is shown.
    // This is equivalent to calling SciChartSurface.configure() with the CDN URL (JSDelivr)
    SciChartSurface.useWasmFromCDN();
}
Check out our new documentation page which covers the options: Deploying Wasm (WebAssembly) and Data Files with your app.
SciChartSurface.create() now accepts an HTMLDivElement or string div ID. So you can pass the HTML node instance directly to the chart instead of an ID. This allows SciChart.js to work in a shadow DOM and is a little syntactic sugar for your applications.
See the SciChartSurface.create() documentation here.
In this release we’ve added properties to a CategoryAxis to let you set defaults so the chart can render empty before data has been added.
// Unix Epoch for March 1st 2022 & March 2nd
const March1st2022 = 1646092800;
const March2nd2022 = 1646179200;
const OneDay = March2nd2022 - March1st2022;
// Creating a CategoryAxis as an XAxis on the bottom
sciChartSurface.xAxes.add(new CategoryAxis(wasmContext, {
// set Defaults so that category axis can draw. Once you add series and data these will be overridden
defaultXStart: March1st2022,
defaultXStep: OneDay,
// Set other properties ...
}));
See the CategoryAxis documentation page here.
Finally, we’ve added a new Axis Type to properly handle dates. The NumericAxis and CategoryAxis will handle dates by adding date formatting for labels. However this doesn’t address all the issues when handling dates instead of numbers on an axis.
So, to resolve this we created a dedicated NumericDateTimeAxis type.
Existing customers with an active support & updates subscription will get the update for FREE.
For new customers or prospects, please contact our sales team and we will be happy to help!
npm install scichart
Don’t forget to see our Tutorials on setting up Npm projects with Webpack!
For developers using vanilla JavaScript (no Node Package Manager), you can load SciChart.js directly in browser. Add this script to your Html head and away you go.
// Add this script to head


// Now Configure SciChartSurface in code to load the wasm file from CDN
SciChart.SciChartSurface.useWasmFromCDN();

// Now create a SciChartSurface as you would normally!
const { sciChartSurface, wasmContext } = await SciChart.SciChartSurface.create("div-id");
We’ve collected all the links to help you get started under scichart.com/downloads. Go there and take a look. If you have any questions just ask!
Best regards,
Andrew
[SciChart Team]
Related Posts
![]()
Queens Award for Innovation
Proud winners of the Queens Award for Innovation, 2019. Awarded on account of our innovative graphics engine which underpins the SciChart library and enables our world-beating charting performance
![]()
National Business Awards
Highly Commended for Lloyds National Business Awards, 2019. Awarded on account of our innovative graphics engine and impressive customer base
![]()
National Technology Awards
Awarded “Healthcare Tech of the Year” at the 2025 National Technology Awards – a top UK recognition for breakthrough innovation in technology.

Reviews
SciChart has received hundreds of verified, 3rd party reviews