iOS & Android v4.7 Has Launched: Everything You Need to Know
iOS and Android v4.7 is here! Take a look at what’s new, including the latest features, bug fixes and examples.

The latest release of SciChart Mobile v4.6.0 (Android & iOS) delivers powerful new features, better performance, improved gesture handling, and more flexible annotations for real-time, high-performance mobile charting. We strongly recommend upgrading to v4.6.0. To get the most out of the updates to our charting features and capabilities, you can find out more in this guide.
🔗Full Changelog: iOS & Android | 🔗Documentation: Android | 🔗Documentation: iOS
| Feature Category | Android | iOS |
| Image Annotation Support | ✅ | ✅ |
| Volume Profile Chart Example | ✅ | ✅ |
| Chart Inside ScrollView | ✅ | ✅ |
| Pinch & Zoom Gesture Enhancements | ✅ | ✅ |
| Selectable + Editable Annotations Example | ✅ | ❌ |
| Zoom State / Gesture Delegates | ❌ | ✅ |
| Safe Area Support / Axis Width | ✅ Fixed Width Axis | ✅ |
| Background for Text Annotations | ❌ | ✅ |
| Crosshair Tooltip Over Axis | ✅ Currently Available | ✅ |
| Custom Axis Annotation | ❌ | ✅ |
| New Examples Library | ✅ | ✅ |
A new example demonstrating how to visualize trading volume distribution across price levels using a dual chart layout.

Embeds a chart inside a ScrollView, with proper touch handling using setDisallowInterceptTouchEvent.

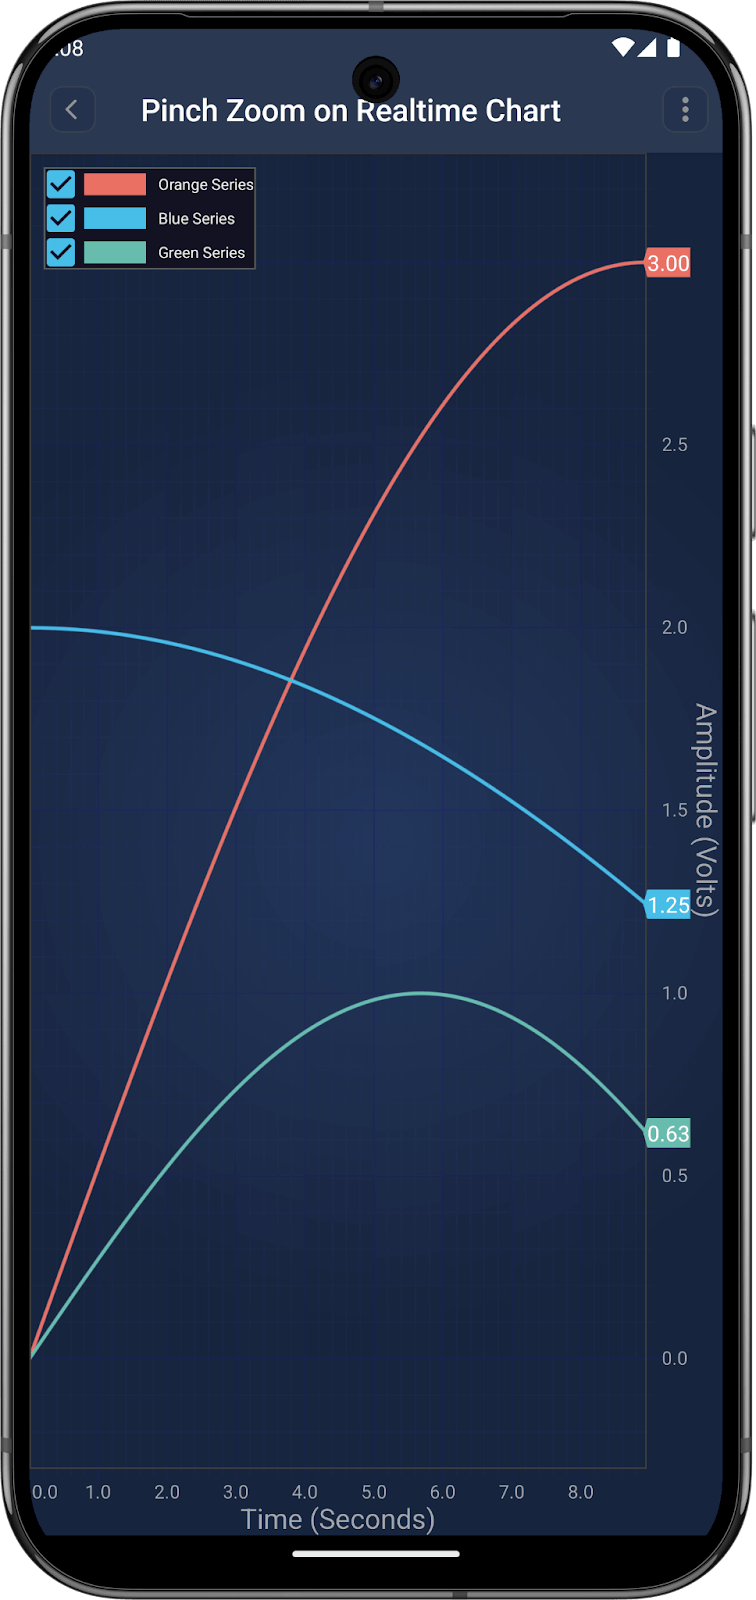
Real-time signal simulation using ScheduledExecutorService and three data series.
This shows how to draw, move, and update annotations using touch gestures.

Live annotations showing current min and max values as the data updates. The annotations values and positions are dynamically calculated, and the y range calculation is customised to take into account the size of the annotations.

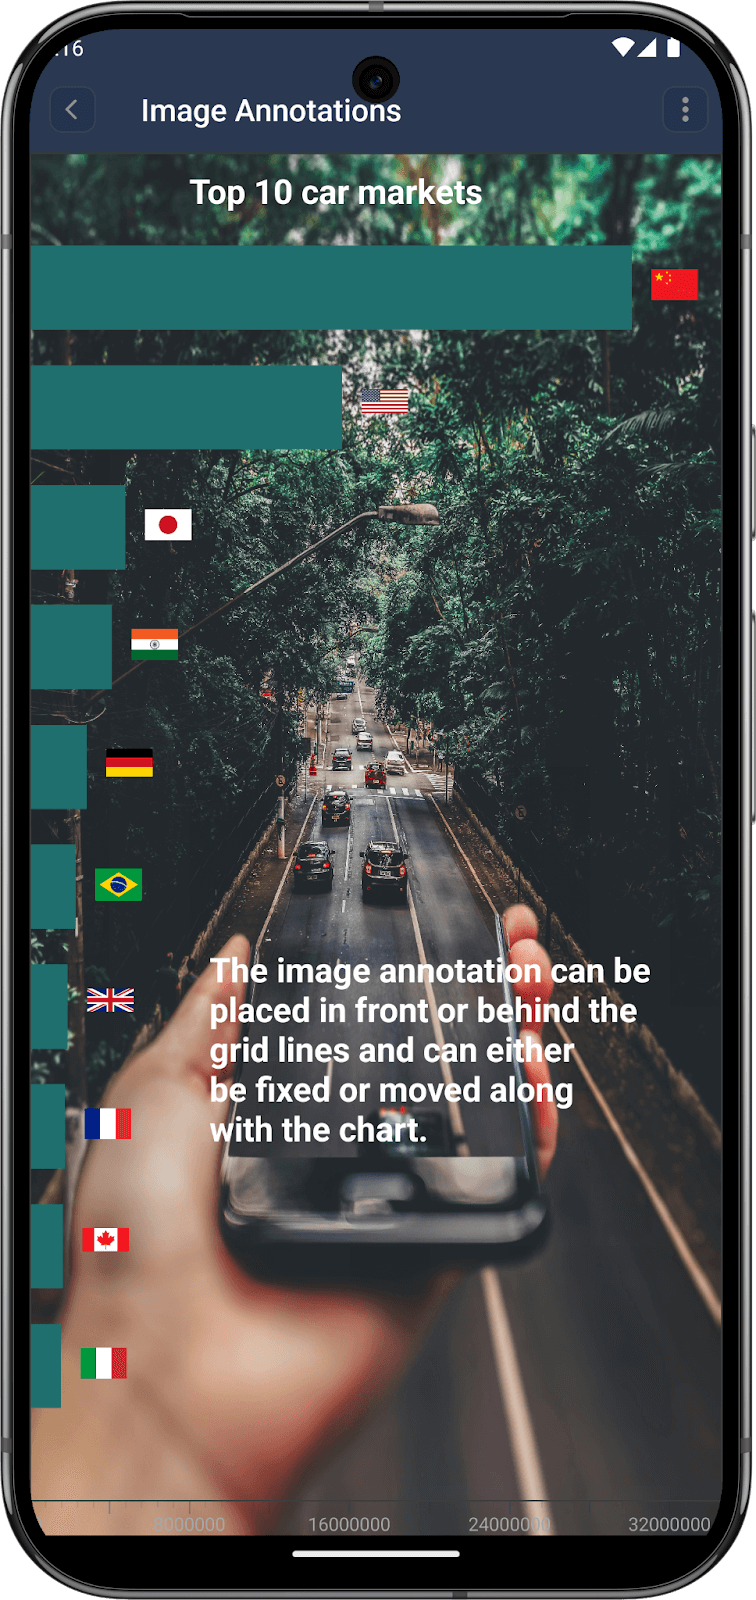
Add images to your chart dynamically using ImageAnnotation. These are drawn using native rendering, so they can be drawn at different layers, including between the gridlines and the series. Normal CustomAnnotations use a separate view and so can only go in front of everything or behind everything. Example code:
// Kotlin (Android)

val imageAnnotation = ImageAnnotation(requireContext())

imageAnnotation.x1 = 0.0

imageAnnotation.y1 = 10.0

imageAnnotation.setDesiredSize(24, 24)

imageAnnotation.setContentMode(ImageView.ScaleType.FIT_START)

imageAnnotation.image = R.drawable.image
Compliant with Apple’s privacy policy, declaring data collection in a manifest file (v4.5.2)
🔗View Example – Pan & Zoom Chart | 🔗 View Example – Toggle Axis Gestures
Add images in point, box, or background mode using SCIImageAnnotation. 🔗 View Example
Add fully custom views to the axis using AxisMarkerCustomAnnotation. 🔗 View Example
New background property for SCITextAnnotation improves visibility. 🔗 View Example – Annotations are Easy
Upgrade Now
Whether you’re building trading dashboards, scientific visualizations, or mobile analytics apps, SciChart Mobile v4.6.0 gives you the tools and performance to push your project further on both Android and iOS. To benefit from all the latest features and updates that our Android chart library and iOS chart library has to offer, make sure to upgrade today.
Related Posts
![]()
Queens Award for Innovation
Proud winners of the Queens Award for Innovation, 2019. Awarded on account of our innovative graphics engine which underpins the SciChart library and enables our world-beating charting performance
![]()
National Business Awards
Highly Commended for Lloyds National Business Awards, 2019. Awarded on account of our innovative graphics engine and impressive customer base
![]()
National Technology Awards
Awarded “Healthcare Tech of the Year” at the 2025 National Technology Awards – a top UK recognition for breakthrough innovation in technology.

Reviews
SciChart has received hundreds of verified, 3rd party reviews