SciChart® the market leader in Fast WPF Charts, WPF 3D Charts, iOS Chart, Android Chart and JavaScript Chart Components
SciChart Android ships with ~90Â Android Chart Examples which you can browse, play with, view the source-code and even export each SciChart Android Chart Example to a stand-alone Android Studio project. All of this is possible with the new and improved SciChart Android Examples Suite, which ships as part of our Android Charts SDK.
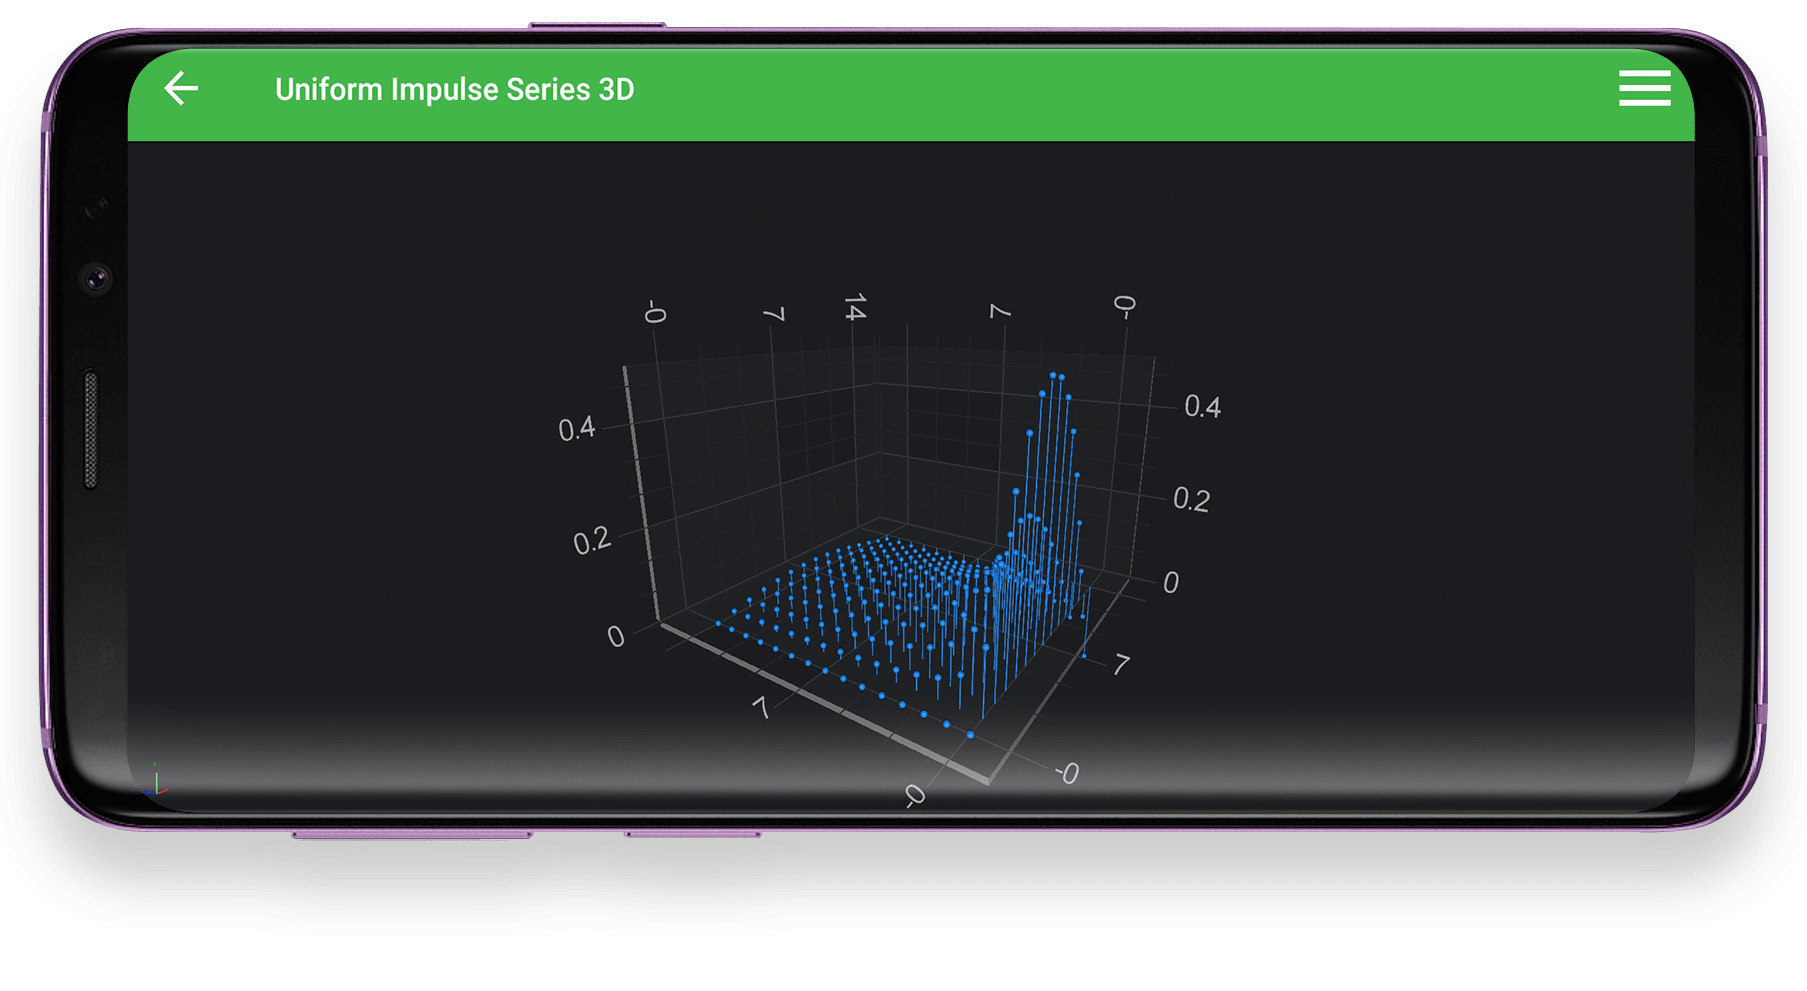
This examples shows how to use ImpulseRenderableSeries3D and UniformGridDataSeries3D to create a Uniform Impulse (Stem) 3D Android Chart. A stem chart is visualised as small stems pointing up or down with different kinds of markers at the top, that could be spheres, cubes or else. These shapes are defined by PointMarker property and has the following shapes out of the box:
To learn more, have a look at SciChart Android The Impulse 3D Chart Type documentation.
The full source code for the Android 3D Uniform Impulse Series example is included below (Scroll down!).
Did you know you can also view the source code from one of the following sources as well?
<?xml version="1.0" encoding="utf-8"?><!--*************************************************************************-->
<!-- SCICHART® Copyright SciChart Ltd. 2011-2018. All rights reserved. -->
<!-- -->
<!-- Web: http://www.scichart.com -->
<!-- Support: support@scichart.com -->
<!-- Sales: sales@scichart.com -->
<!-- -->
<!-- example_single_chart3d_fragment.xml is part of the SCICHART® Examples. Permission is hereby granted -->
<!-- to modify, create derivative works, distribute and publish any part of this source -->
<!-- code whether for commercial, private or personal use. -->
<!-- -->
<!-- The SCICHART® examples are distributed in the hope that they will be useful, but -->
<!-- without any warranty. It is provided "AS IS" without warranty of any kind, either -->
<!-- expressed or implied. -->
<!--*************************************************************************-->
<LinearLayout xmlns:android="http://schemas.android.com/apk/res/android"
android:layout_width="match_parent"
android:layout_height="match_parent"
android:orientation="vertical">
<com.scichart.charting3d.visuals.SciChartSurface3D
android:id="@+id/chart3d"
android:layout_width="fill_parent"
android:layout_height="fill_parent" />
</LinearLayout>
//******************************************************************************
// SCICHART® Copyright SciChart Ltd. 2011-2018. All rights reserved.
//
// Web: http://www.scichart.com
// Support: support@scichart.com
// Sales: sales@scichart.com
//
// CreateSparseImpulseSeries3DFragment.java is part of the SCICHART® Examples. Permission is hereby granted
// to modify, create derivative works, distribute and publish any part of this source
// code whether for commercial, private or personal use.
//
// The SCICHART® examples are distributed in the hope that they will be useful, but
// without any warranty. It is provided "AS IS" without warranty of any kind, either
// expressed or implied.
//******************************************************************************
package com.scichart.examples.fragments.charts3d;
import com.scichart.charting3d.model.dataSeries.grid.UniformGridDataSeries3D;
import com.scichart.charting3d.visuals.SciChartSurface3D;
import com.scichart.charting3d.visuals.axes.NumericAxis3D;
import com.scichart.charting3d.visuals.camera.Camera3D;
import com.scichart.charting3d.visuals.renderableSeries.impulse.ImpulseRenderableSeries3D;
import com.scichart.core.framework.UpdateSuspender;
import com.scichart.drawing.utility.ColorUtil;
import com.scichart.examples.R;
import com.scichart.examples.fragments.base.ExampleBaseFragment;
import butterknife.BindView;
public class CreateUniformImpulseSeries3DFragment extends ExampleBaseFragment {
private static final int COUNT = 15;
@BindView(R.id.chart3d)
SciChartSurface3D surface3d;
@Override
protected int getLayoutId() {
return R.layout.example_single_chart3d_fragment;
}
@Override
protected void initExample() {
final UniformGridDataSeries3D<Double, Double, Double> ds = new UniformGridDataSeries3D<>(Double.class, Double.class, Double.class, COUNT, COUNT);
for (int x = 0; x < COUNT; x++) {
for (int z = 0; z < COUNT; z++) {
final double y = Math.sin(x * .25) / ((z + 1) * 2);
ds.updateYAt(x, z, y);
}
}
final Camera3D camera = sciChart3DBuilder.newCamera3D().build();
final NumericAxis3D xAxis = sciChart3DBuilder.newNumericAxis3D().withGrowBy(.1, .1).build();
final NumericAxis3D yAxis = sciChart3DBuilder.newNumericAxis3D().withVisibleRange(0, .5).withGrowBy(.1, .1).build();
final NumericAxis3D zAxis = sciChart3DBuilder.newNumericAxis3D().withGrowBy(.1, .1).build();
final ImpulseRenderableSeries3D rs = sciChart3DBuilder.newImpulseSeries3D()
.withDataSeries(ds)
.withStroke(ColorUtil.DodgerBlue)
.withStrokeThicknes(1f)
.withPointMarker(sciChart3DBuilder.newSpherePointMarker3D().withSize(5).withFill(ColorUtil.DodgerBlue).build())
.build();
UpdateSuspender.using(surface3d, new Runnable() {
@Override
public void run() {
surface3d.setCamera(camera);
surface3d.setXAxis(xAxis);
surface3d.setYAxis(yAxis);
surface3d.setZAxis(zAxis);
surface3d.getRenderableSeries().add(rs);
surface3d.getChartModifiers().add(sciChart3DBuilder.newModifierGroupWithDefaultModifiers().build());
}
});
}
}