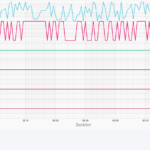
The SciChart Legend and Cursor Tooltip (Showed only Y axis value) are not display after changing the graph layout.
I need to show the graph legend and Tooltip for all the Y axis.
The chart should also show the x axis value and y axis value on the Tooltip for more clarity.
Before changing the layout the legend was showing the five series vertically one below the other. But i need to show the five legends in horizontally (One after the another).
I have added the chart definition code. The data is added though Ajax call and code for that ajax call is not added.
I have attached the image for your reference.
I have attached the zip file with the html file.
- Leo Leslin asked 2 years ago
- last edited 2 years ago
 Hi Leo, please click the Code button at the top of the forum to ensure code snippets are correctly formatted. Also, if reporting what you suspect is a bug, why not use something like JSFiddle or Codesandbox.io to show the bug condition? That will allow our engineers to very quickly debug it and provide a solution.
 I have attached the zip file with the html file to the question raised above, which has the source code with sample data. I need the legend and tooltip to be added to the chart. The legend should be shown in horizontally.
- You must login to post comments
Hi
To make the legend display horizontally, configure it like this:
sciChartSurface.chartModifiers.add(new SciChart.LegendModifier({placementDivId: “legend-div-id”, showCheckboxes: true, orientation: SciChart.ELegendOrientation.Horizontal}));
Since you are putting the legend in an external div, you need to make sure that div can size to fit – so remove the fixed width from your legend div in the html.
I noticed scichart throwing some errors which are related to bugs we have recently fixed. This is what is preventing the tooltips displaying. If you update the version to 3.0.0-beta.235 those errors will go away. You also need to update the versions in the SciChart.SciChartSurface.configure lines, or just use SciChart.SciChartSurface.useWasmFromCDN(); which automatically gets the correct version of wasm and data.
You probably do not need both rollover and cursorModifier together. RolloverModifier will place tooltips on each series, which cursorModifier will collect them and show them all by the cursor. For cursorModifier you need to explicitly turn tooltips on with showTooltips:true.
3.0 should be leaving beta really soon – we’re just doing last bits of documentation.
Regards
David
- David Burleigh answered 2 years ago
- You must login to post comments
Please login first to submit.

