Building a Smith Chart in JavaScript: Inside the Rendering Pipeline
See how SciChart.js was extended to build a fully interactive Smith chart using standard APIs. This article highlights the flexibility of custom rendering and advanced interactions.
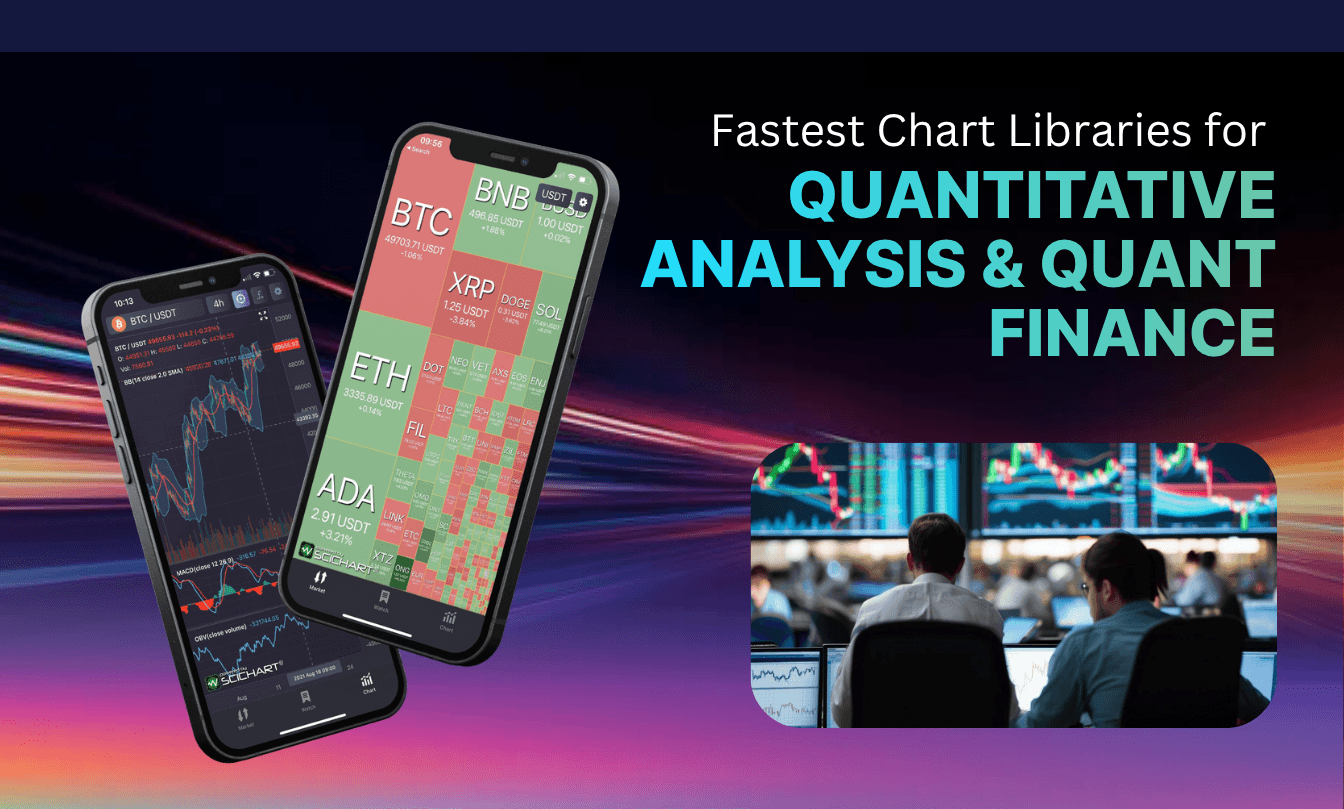
Developers with experience building trading architecture know that quantitative finance runs on instantaneous data rendering. While open-source tools, such as uPlot and Apache ECharts, offer lightweight solutions for basic applications, advanced financial chart developers require rendering engines with a little more power behind them. SciChart leads the market in performance, providing the most comprehensive, customizable ecosystem for visualizing over 100 million data points in real time.
The fastest chart libraries for quantitative analysis are high-performance rendering engines engineered to process multi-million point, real-time financial datasets. By using hardware-accelerated WebGL or WebAssembly frameworks, these specialized libraries, such as SciChart, bypass standard browser main-thread bottlenecks to ensure fluid visual execution during periods of high market volatility.
Your underlying architecture dictates how efficiently an application handles large data throughput, so it’s wise to invest a little time in choosing it. To help you get started in your research, we’re reviewing the most prominent rendering libraries used across the quantitative finance sector in 2026.
The context behind where the data outlined in this article, can be replicated using our GitHub performance benchmark test suite.
For developers seeking an exceptionally lightweight footprint, uPlot is a trusty open-source option. It delivers fast initial load times and decent basic performance by focusing solely on core charting features.
From an advanced perspective, uPlot achieves its speed by sticking to a highly optimized, synchronous canvas rendering path.
However, it handles data updates sequentially on the main UI thread. When you try to push structured order book depths or concurrent multi-asset tick streams into it, the main thread locks up immediately, making live interaction impossible during high volatility.
Highcharts is widely adopted in corporate environments for its out-of-the-box visual polish, feature set, and accessibility features.
However, because it processes graphics on the CPU thread and forces browser repaints for every data change, it’s ill-suited for live market tick feeds, high-frequency backtesting loops, or complex multi-pane trading layouts.
Plotly.js is an open-source library used by data scientists for its native integration with Python, R, and Julia. While it introduces WebGL acceleration for certain chart types (like 3D point clouds and scatter plots), its underlying architecture remains heavily anchored to D3.js and SVG wrappers, limiting its efficiency.
Perspective is an interactive analytics component designed for large-stream datasets rather than just standard charting.
Perspective handles the heavy lifting by compiling its core C++ analytical engine to WebAssembly. This allows it to perform complex data reductions, aggregations, and delta-updates completely off the main thread. While its ability to manipulate huge data arrays in real time is phenomenal, its visualization layer is essentially a wrapper for other chart renderers.
Our verdict? It’s an excellent analytical tool, but it lacks the explicit visual control required for complex financial graphics.
Apache ECharts is a highly versatile, feature-rich visualization library widely adopted across various web industries.
ECharts uses a declarative option-cloning system that is highly intuitive for standard web apps. But for high-frequency quantitative dashboards, that abstraction can be a disaster. Every dynamic data change triggers massive object instantiation and garbage collection spikes.
Once you cross into historical backtesting scales or volatile order book depths, the canvas layout engine struggles on path recalculations. This ultimately causes frame drop rates to plummet.
When the sheer scale of your data becomes a bottleneck, SciChart represents the industry standard for enterprise financial systems. Built on a proprietary C++ rendering engine called Visual Xccelerator™, it bridges the gap between raw native speed and web applications via WebAssembly, WebGL, and an alpha version of WebGPU.
What sets SciChart apart for senior systems architects is how it manages the hardware interface. By compiling its core C++ graphics engine straight to WebAssembly, it implements WASM-SIMD vectorization and direct manual memory management.
This means you’re completely bypassing the browser’s volatile garbage collector. It handles incoming market feeds using highly efficient native FIFO memory structures and lossless adaptive resampling algorithms. This guarantees zero memory growth and reliable 60 FPS performance, even when rendering hundreds of technical indicators over multi-million point historical datasets.
The following matrix provides a clear breakdown of how these libraries stack up under heavy data stress – an inevitable part of quantitative analysis applications.
| Chart Library | Rendering Tech | Max Data Points | Financial Customization | Tech Support Type |
| uPlot | Canvas 2D | ~1 million | Low | GitHub Community |
| Highcharts | SVG + WebGL via its Boost module | ~50,000 points | High | Commercial |
| Plotly | Hybrid SVG + WebGL | ~20,000 | High | Community & Tiered Commercial |
| Perspective | WebAssembly / WebGL | ~10 million | Medium | Open-Source Community |
| Apache ECharts | Canvas / SVG | < 500,000 | High | Open-Source Community |
| SciChart | Visual Xccelerator™ (C++/WebGL) | 100 million+ | Unmatched | Enterprise & AI Assistant |
To prevent system failures, we recommend GPU hardware acceleration. At our level of application design, raw painting speed isn’t your only bottleneck. You also want to know how the library manages memory, garbage collection overhead, and cross-runtime serialization.
If you’re a financial chart developer, you’ve probably seen your fair share of charting shortcuts blow up in production. When tracking high-frequency trading feeds or running complex risk models, a delayed UI chart is insufficient for real-time risk assessment.
This often stems from choosing the wrong rendering engine. If performance degradation, sudden browser tab crashes, and unresponsive user interfaces are all banned phrases for your application development, then we recommend choosing a fast chart library that is specifically engineered for quantitative analysis.
Building institutional-grade trading platforms requires tools that render your data, even when pushed to the limits. SciChart offers the most advanced chart library support for financial chart developers. It provides native-grade speed across JavaScript, React, and WPF platforms, backed by a dedicated engineering team and an AI support assistant.
SciChart offers all the tools you need to build top-spec quant finance apps, including advanced drawing tools that help you trade in your current static drawings for interactive, editable annotations.
Get started with SciChart’s financial chart library today to eliminate rendering bottlenecks.
SciChart is considered by financial chart developers to be one of the best choices for real-time trading dashboards due to its hybrid C++ and WebAssembly engine. SciChart.js charts easily display more than 100 million data points.
Most open-source chart libraries rely on standard HTML Canvas or SVG rendering which present their own limitations. With SVG, for instance, every data point gets its own DOM node which can overload a browser when you’re handling larger datasets. This can result in lag or memory leaks when handling rapid market feeds.
Yes, SciChart features deep native integration for modern web development, allowing you to build reactive, high-performance interfaces using specialized wrappers for React charts, Vue, and Angular.
Recent Blogs
![]()
Queens Award for Innovation
Proud winners of the Queens Award for Innovation, 2019. Awarded on account of our innovative graphics engine which underpins the SciChart library and enables our world-beating charting performance
![]()
National Business Awards
Highly Commended for Lloyds National Business Awards, 2019. Awarded on account of our innovative graphics engine and impressive customer base
![]()
National Technology Awards
Awarded “Healthcare Tech of the Year” at the 2025 National Technology Awards – a top UK recognition for breakthrough innovation in technology.

Reviews
SciChart has received hundreds of verified, 3rd party reviews