I have no idea. It sounds like a similar error VS puts out (in English) – the type X cannot be found in the namespace Y.
Typically when I’ve seen this its been a badly resolved reference, e.g. you have two DLLs of different versions referenced by different projects, or, you have recently upgraded the DLL version and Visual Studio has not cleared its cache.
Try restarting Visual Studio, deleting all Bin/Obj directories and doing a clean re-build. Does it work?
If not, try creating a blank project and start including these classes. Can Visual Studio see them?
Andrew
- Andrew Burnett-Thompson answered 10 years ago
Hi Danila,
Please take a look on this thread – Correlating metadata with datapoints. It shows several possible approaches to add additional information for data points in your series.
Hope it helps!
- Yura Khariton answered 9 years ago
- last active 9 years ago
Hi Uwe,
Thanks for your questions. Concerning the coordinate transformation for CategoryAxis, please take a look at this article from our Knowledgebase. The last section explains the case of CategoryAxis.
As to axis initialization, it is not possible to render a CategoryAxis without having any data on associated with it, since it is index-based. So you should append at least 1 data point, or two if you want a certain VisibleRange as the initial one. There is a special Y value reserved for such cases (also for making gaps), it is double.NaN. Therefor you could append a two data points with double.NaN as Y values and then remove/update them when actual data comes.
Hope this helps!
- Guest answered 9 years ago
The available size can be calculated from the parameters of the CustomAxisLayoutStrategy.layout method
public layoutAxes(
  left: number,
  top: number,
  right: number,
  bottom: number,
  axes: AxisBase2D[]
): void
left, top, right, bottom – define an area where the current group of axes with the same alignment will be placed. Where each of the params is an appropriate offset value (in canvas coordinates) from the canvas viewport rectangle.
To get a horizontal space available for the bottom axes calculate right – left
Try checking those limits and applying a proper axisLength rounding.
- Jim Risen answered 9 months ago
- last active 9 months ago
Hello mssup,
Before you try present busy indicator, please see our performance tips and tricks article, it might help you to omit such issues in the first place.
First of all, I would suggest you to append data in batches and inside SCIUpdateSuspender block, like below:
[SCIUpdateSuspender usingWithSuspendable:surface withBlock:^{
    // append your data here
}];
which should improve performance, also, the SciChart renderer will start rendering right after step out of the block, so you can consider end of the block as start rendering, and can show your busy indicator.
To listen to end of drawing rendererCallback property on renderSurface, please see the code below:
self.surface.renderSurface.renderedCallback = ^(int _) {
    <#code#>
};
in which you can stop showing your indicator.
Hope that helps, if you still face some issues, feel free to prepare sample project and send us for investigation.
UPDATE for SciChart.iOS v3.x
renderedCallback is removed in v3.x and now it’s replaced by the SCIChartSurfaceRenderedListener block. Please see the code below:
    self.surface.setRenderedListener { (surface, renderedMessage) in
        print("SurfaceRendered")
        <#code#>
    }
Best regards,
Nazar R.
- Nazar Rudnyk answered 5 years ago
- last active 4 years ago
Published workaround.
We are not sure why the DLL file sharpdx_direct3d11_1_effects_x86.dll is not pickled up by the Visual Studio designer, no matter what we try we cannot get it to work either. So we have this workaround.
Please enable DirectX only when NOT in the designer, like so:
    <s:SciChartSurface >
        <s:SciChartSurface.Style>
            <Style TargetType="{x:Type s:SciChartSurface}">
                <Style.Triggers>
                    <!-- Enable DirectX only when not in designer -->
                    <Trigger Property="componentModel:DesignerProperties.IsInDesignMode" Value="False">
                        <Setter Property="s3D:DirectXHelper.TryApplyDirectXRenderer" Value="True" />
                        <Setter Property="s3D:DirectXHelper.FallbackType" Value="{x:Type s:HighQualityRenderSurface}" />
                    </Trigger>
                </Style.Triggers>
            </Style>
        </s:SciChartSurface.Style>
        <s:SciChartSurface.XAxis>
            <s:NumericAxis/>
        </s:SciChartSurface.XAxis>
        <s:SciChartSurface.YAxis>
            <s:NumericAxis/>
        </s:SciChartSurface.YAxis>
    </s:SciChartSurface>
Best regards,
Andrew
- Andrew Burnett-Thompson answered 5 years ago
Hi Rashid,
You’re probably using steps which were added for v2.x. Please take a look on updated tutorial for v3, but there will be one minor change because v3 is in beta now and instead of :
// Declaring a new Maven repository
maven { url 'https://www.myget.org/F/abtsoftware/maven' }
there should be maven repository for bleeding edge releases where we published beta:
// Declaring a new Maven repository
maven { url 'https://www.myget.org/F/abtsoftware-bleeding-edge/maven' }
Hope this will help you!
Best regards,
Yura
- Yura Khariton answered 4 years ago
Hi there,
You need to call IAnnotation.Hide() to make it disappear and IAnnotation.Show() to display it again. Thanks for your enquiry, we’ll look how to improve usability of this.
Hope this helps!
Best regards,
Yuriy
- Yuriy Zadereckiy answered 11 years ago
I am considering applying server-side licensing for my javerScript application.
In the document below, there is a phrase “Our server-side licensing component is written in C++.”
(https://support.scichart.com/index.php?/Knowledgebase/Article/View/17256/42/)
However, there is only asp.net sample code on the provided github.
(https://github.com/ABTSoftware/SciChart.JS.Examples/tree/master/Sandbox/demo-dotnet-server-licensing)
I wonder if there is a sample code implemented in C++ for server-side licensing.
Can you provide c++ sample code?
Also, are there any examples to run on Ubuntu?
- Andrew Burnett-Thompson answered 11 years ago
Hi, there.
SCILegendModifier has property called sourceMode.
What you can do is to set ‘sourceMode’ to .selectedSeries and then select your renderableSeries, like this:
let legendModifier = SCILegendModifier()
legendModifier.sourceMode = .selectedSeries

let line4 = SCIFastLineRenderableSeries()
line4.isSelected = true
Another option is to create your custom legend, which is a collectionView under the hood, with custom dataSource. Here you can find a link to the documentation
Hope, that helped.
- Andriy P answered 3 years ago
Hi there,
Two ways you can do this – you can set an explicit Width, or MaxWidth on the Y-Axes, or alternatively you can use the attached property SciChartGroup.VerticalChartGroup which will lock the sizes of Y-Axes to the same width.
Example usage:
<!-- A first vertically aligned chart -->
<s:SciChartSurface x:Name="chart0" s:SciChartGroup.VerticalChartGroup="myGroup">
   <!-- RenderableSeries, DataSet, XAxis omitted for brevity -->
</s:SciChartSurface>

<!-- A second vertically aligned chart -->
<s:SciChartSurface x:Name="chart1" s:SciChartGroup.VerticalChartGroup="myGroup">
   <!-- RenderableSeries, DataSet, XAxis omitted for brevity -->
</s:SciChartSurface>
- Andrew Burnett-Thompson answered 11 years ago
Hi Artem
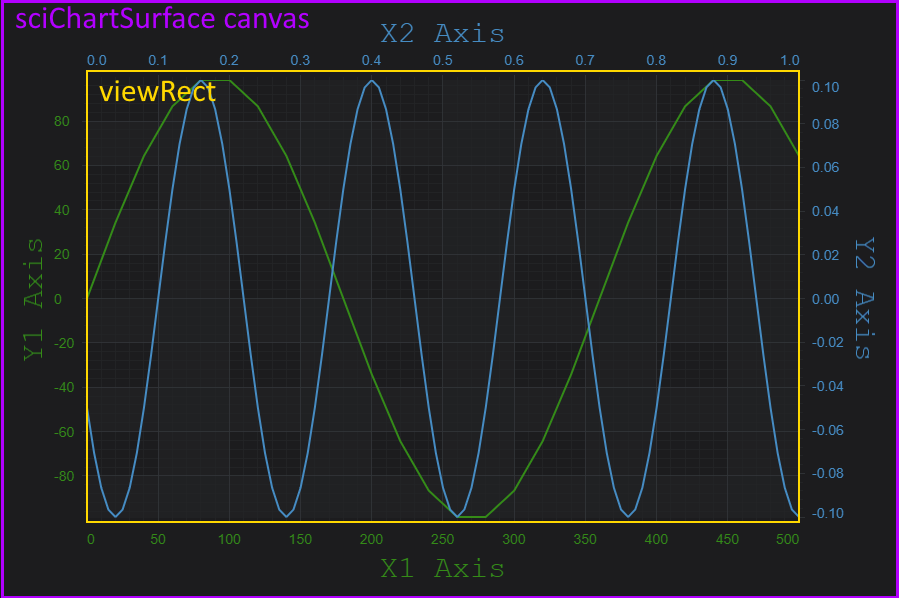
You can convert between Data and Pixel coordinates in SciChart.js using this API
Axis APIs – Convert Pixel to Data Coordinates
If you have the data-value for the series, pass it to the YAxis coordinate calculator to do the conversion, like this:
const yAxis = sciChartSurface.xAxes.get(0); // Type AxisBase2D
const coordCalc = yAxis.getCurrentCoordinateCalculator(); // Type CoordinateCalculatorBase
// Gets the pixel coordinate relative to viewRect for data-value 1.23 on this axis only
const coord = coordCalc.getCoordinate(1.23);

// Converts a pixel coordinate back to dataValue
const dataValue= coordCalc.getDataValue(coord);

// dataValue should === 1.23
For the x-Axis there is a slightly different approach needed if you are using CategoryAxis. This is covered in the KB article linked above.
Finally, please ensure you understand where coordinates are measured from, also covered in the article above.
![]()
There is a note in the docs about how to convert between the inner and outer canvas / viewrect in case you need it.
Best regards,
Andrew
- Andrew Burnett-Thompson answered 3 years ago
- last active 3 years ago
Hi there,
Unfortunately, VerticalLineAnnotation doesn’t provide such a feature for now. However, some users have implemented this behavior by themselves, please, take a look at this thread and find the links in the last post.
Hope this helps!
Best regards,
Yuriy
- Yuriy Zadereckiy answered 10 years ago
UPDATE
As it happens we’ve coded in to SciChart v3.1 a property to show tooltips on different actions:
////// Gets or sets when to show tooltips /// public ShowTooltipOptions ShowTooltipOn { get { return (ShowTooltipOptions)GetValue(ShowTooltipOnProperty); } set { SetValue(ShowTooltipOnProperty, value); } }
Where ShowTooltipOn will be defined as
////// Specifies actions that cause roolover tooltip to be shown /// public enum ShowTooltipOptions { ////// Show tooltip when mouse is over point /// MouseOver, ////// Show tooltip when mouse hovers over the surface /// MouseHover, ////// Show tooltip always /// Always, ////// Show tooltip when mouse left button is pressed /// MouseLeftButtonDown, ////// Show tooltip when mouse right button is pressed /// MouseRightButtonDown, ////// Show tooltip when mouse middle button is pressed /// MouseMiddleButtonDown }
This will be available shortly as part of SciChart v3.1.
- Andrew Burnett-Thompson answered 10 years ago
Hi Sander,
We’ve investigated the issue and done slight changes in order to allow creating a custom AxisInfo. You should derive your own type from AxisInfo, it will act as a ViewModel. Then override the HitTest method on an axis, create and initialize the instance of that type there and return it.
So if you try out the nightly build tomorrow, the following code should do the trick:
    public class CustomAxis : NumericAxis
{
    public override AxisInfo HitTest(IComparable dataValue)
    {
        var result = new CustomAxisInfo { MyProperty1 = "MyProperty1", MyProperty2 = "MyProperty2" };

        var axisInfo = base.HitTest(dataValue);

        // Copy all the values from axisInfo here

        return result;
    }
}

public class CustomAxisInfo : AxisInfo
{
    public string MyProperty1 { get; set; }

    public string MyProperty2 { get; set; }
}
And here is a label template sample:
            <ControlTemplate x:Key="AxisLabelTemplate" TargetType="s:TemplatableControl">
            <Grid>
                <Rectangle Width="100" Height="50" Fill="Yellow"/>
                <TextBlock Text="{Binding MyProperty1}"/>
            </Grid>
        </ControlTemplate>
Also we will consider if we can provide a bit more convenient way to do this in next versions, for instance via a custom LabelProvider.
Please let us know your thoughts about this solution,
Best regards,
Yuriy
- Guest answered 10 years ago
I am considering applying server-side licensing for my javerScript application.
In the document below, there is a phrase “Our server-side licensing component is written in C++.”
(https://support-dev.scichart.com/index.php?/Knowledgebase/Article/View/17256/42/)
However, there is only asp.net sample code on the provided github.
(https://github.com/ABTSoftware/SciChart.JS.Examples/tree/master/Sandbox/demo-dotnet-server-licensing)
I wonder if there is a sample code implemented in C++ for server-side licensing.
Can you provide c++ sample code?
Also, are there any examples to run on Ubuntu?
- Andrew Burnett-Thompson answered 7 years ago
Hi Marcin,
Yes, it’s possible to render chart in memory. We have an example in our demo application which we use internally for testing of chart export. You can use it as reference for implementing chart export in memory for your application:
 public void exportChartInMemory() {
    final SciChartSurface sciChartSurface = new SciChartSurface(getActivity());

    setRenderSurface(sciChartSurface, renderSurface);
    sciChartSurface.setTheme(themeId);

    initSurface(sciChartSurface);

    SciChartSurfaceExportUtil.prepareSurfaceForExport(sciChartSurface, 800, 600);

    imageView.setImageBitmap(sciChartSurface.exportToBitmap());
}
Hope that this will help you!
Best regards,
Yura
- Yura Khariton answered 6 years ago
Hi there
For SciChart WPF the licensing procedure is as follows:
1.) Activate your developer license (instructions here for WPF v5, Instructions here for WPF v6)
2.) Include the runtime key in your application (Instructions for WPF v5, Instructions for WPF v6)
After that, if you still get problems, you can try our Licensing Troubleshooting steps here:
1.) Troubleshooting steps for scichart wpf v5
2.) Troubleshooting steps for scichart wpf v6
By far the most common errors with licensing are:
- Activating with the v6 Licensing Wizard and using SciChart WPF v5
- Activating with the v5 Licensing Wizard and using SciChart WPF v6
- Activating and not applying a runtime key
- Applying a runtime key and not activating
- Applying an out of date runtime key or license
Let me know if this helps
Best regards,
Andrew
- Andrew Burnett-Thompson answered 4 years ago
- last active 4 years ago
I am considering applying server-side licensing for my javerScript application.
In the document below, there is a phrase “Our server-side licensing component is written in C++.”
(https://support.scichart.com/index.php?/Knowledgebase/Article/View/17256/42/)
However, there is only asp.net sample code on the provided github.
(https://github.com/ABTSoftware/SciChart.JS.Examples/tree/master/Sandbox/demo-dotnet-server-licensing)
I wonder if there is a sample code implemented in C++ for server-side licensing.
Can you provide c++ sample code?
Also, are there any examples to run on Ubuntu?
- Andrew Burnett-Thompson answered 9 years ago
Good day
Sorry for slow response
To achieve desired behaviour you need to do following steps:
1) Create Y axis, set alignment Top or Bottom, set it flipped and attach to surface
id<SCIAxis2D> yAxis = [[SCINumericAxis alloc] init];
yAxis.axisId = @"yAxis";
[yAxis setFlipCoordinates:YES];
[yAxis setAxisAlignment:SCIAxisAlignment_Top];
[surface attachAxis:yAxis IsXAxis:NO];
2) Create X axis, set alignemnt Left or Right and attach to surface
id<SCIAxis2D> xAxis = [[SCIDateTimeAxis alloc] init];
xAxis.axisId = @"xAxis";
[xAxis setAxisAlignment:SCIAxisAlignment_Left];
[surface attachAxis:xAxis IsXAxis:YES];
Please let me know if it solved your problem.
I’ve added resulting charts in attachment, if it is not what you want to achieve, send some scetch drawing with desired charts layout, please
Best regards
Andrii
SciChart iOS Developer
- Andrii Poliuk answered 8 years ago
