DirectX Compatibility in WPF Charts with SciChart
SciChart now features an optional DirectX10 based renderer. This is currently included as an add-on to the SciChart High Performance […]

We’ve moved over to a new format for communicating our releases and updates of our popular WPF Chart library, by publishing a rolling changelog of every fix or enhancement in SciChart.
You can find the changelogs in the top menu at Developers -> Changelogs -> SciChart WPF ChangeLog
This release (v8.10.0 build 28840) is a cumulative update with fixes and minor enhancements which is backward compatible to version 8.0 of SciChart WPF. It’s recommended for all users on v8.x to upgrade.
To find out what is new since v8.9, read on below:
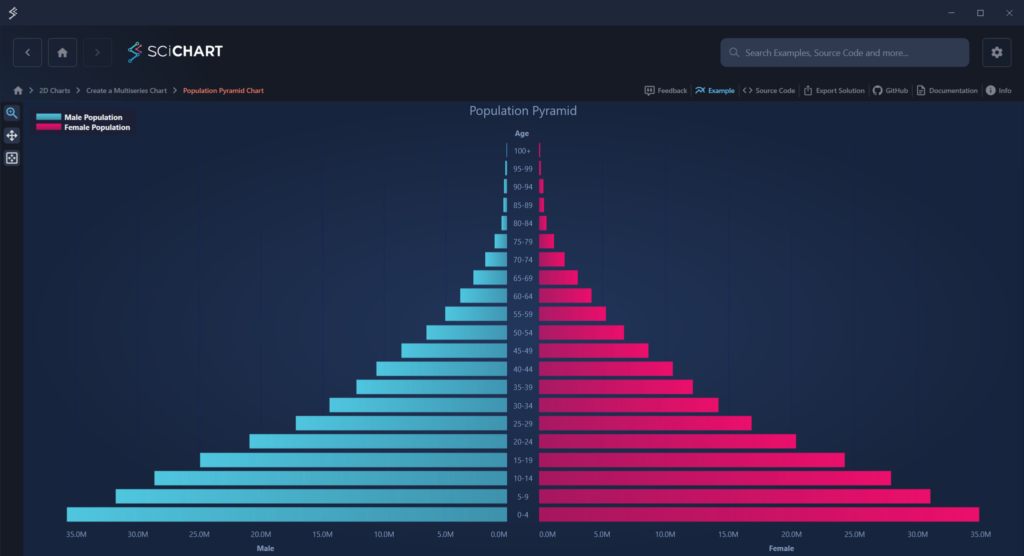
This example visualizes real-world demographic data using separate stacked column series for male and female populations. The chart is rendered on a single SciChartSurface, with a custom axis layout achieved by supplying non-default WPF panels for the axes. A custom LabelProvider is used to generate age range labels, ensuring the demographic data remains clear and easy to interpret. Besides, the chart features synchronized interactions, with zooming and panning fully synchronized across both charts.
A new property, HeightScaleFactor, has been added to FreeSurfaceRenderableSeries3D to give developers fine control over how strongly the height map displaces the mesh surface. Setting this value to 0.0 disables displacement entirely, rendering the surface flat, while the value of 1.0 applies the height map at full intensity:

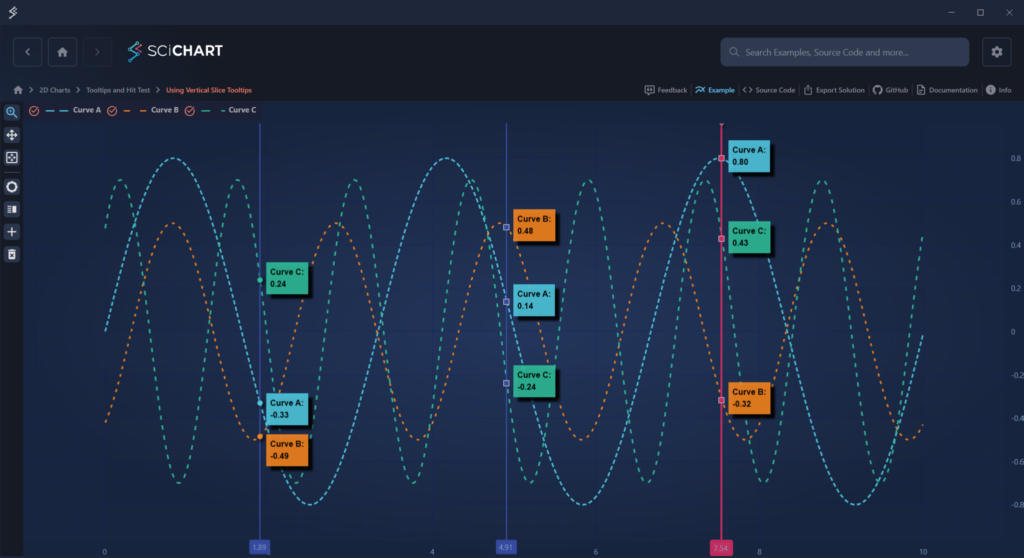
A new attached property, RolloverMarkerTemplate, has been added to VerticalSliceModifier, allowing you to define custom Rollover Markers per VerticalLineAnnotation, rather than per RenderableSeries.
By setting VerticalSliceModifier.RolloverMarkerTemplate on a specific VerticalLineAnnotation, you can now customize the appearance of rollover markers for that slice. The VerticalLineAnnotation serves as the DataContext for the template, and all markers associated with that line will use the defined appearance:
We’ve resolved a hardware-specific memory leak that affected users running the hardware-accelerated renderer (Visual Xccelerator) on certain GPU configurations, notably older AMD GPUs.
This issue manifested in various ways, such as:
This has now been addressed, and we recommend users experiencing similar symptoms on affected hardware to upgrade to this version.
Full list of changes for this and previous updates can be found at the SciChart WPF Changelog.
SciChart WPF v8.10 is available by:
We welcome your feedback! Please let us know what you think about our new features, examples and improvements. You can contact our friendly, helpful team at any time!
Related Posts
![]()
Queens Award for Innovation
Proud winners of the Queens Award for Innovation, 2019. Awarded on account of our innovative graphics engine which underpins the SciChart library and enables our world-beating charting performance
![]()
National Business Awards
Highly Commended for Lloyds National Business Awards, 2019. Awarded on account of our innovative graphics engine and impressive customer base
![]()
National Technology Awards
Awarded “Healthcare Tech of the Year” at the 2025 National Technology Awards – a top UK recognition for breakthrough innovation in technology.

Reviews
SciChart has received hundreds of verified, 3rd party reviews