DirectX Compatibility in WPF Charts with SciChart
SciChart now features an optional DirectX10 based renderer. This is currently included as an add-on to the SciChart High Performance […]

We’ve moved over to a new format for communicating our releases and updates of our popular WPF Chart library, by publishing a rolling changelog of every fix or enhancement in SciChart.
You can find the changelogs in the top menu at Developers -> Changelogs -> SciChart WPF ChangeLog
This release (v8.9.0 build 28760) is a cumulative update with fixes and minor enhancements which is backward compatible to version 8.0 of SciChart WPF. It’s recommended for all users on v8.x to upgrade.
To find out what is new since v8.8, read on below:
This example demonstrates a common use case in Oil and Gas exploration – visualization of chart dashboards, arranged vertically. These are used to visualize parameters such as missing drill speed, rock type or hardness, temperature and pressure with increasing well depth. The Oil and Gas Wells dashboard combines a few techniques in SciChart WPF chart library to create a beautiful 2D/3D chart demonstration.
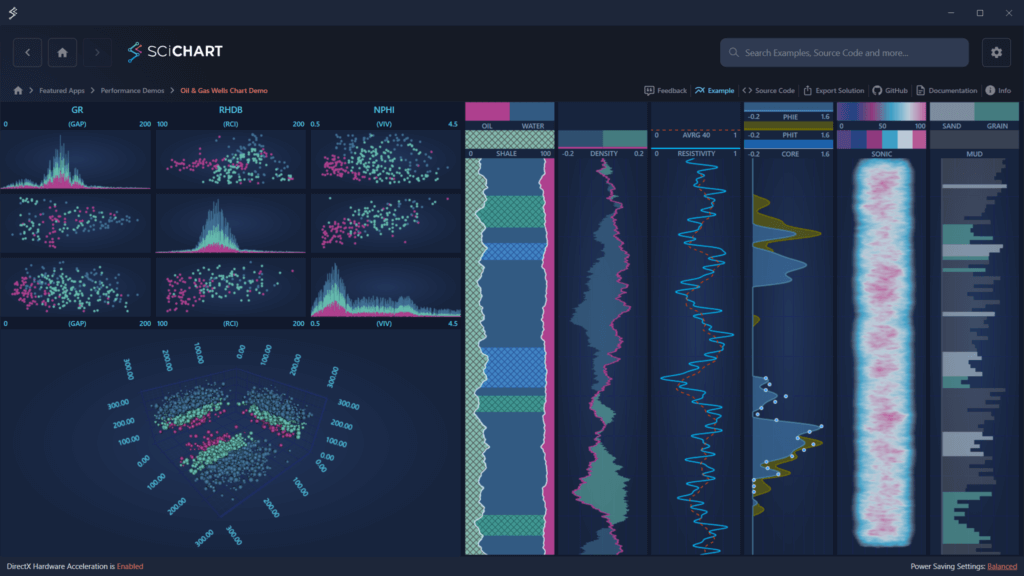
The example demonstrates usage of the following features:
Vertical Charts
A series of 2D charts – Line, Column, Area, Band, and Heatmap Charts, are arranged vertically using SciChart MVVM API. In addition, PaletteProvider API is used to dynamically highlight important chart regions (e.g., shale vs. sand, oil-bearing zones, etc.), enhancing visual insights
Scatter Plot Dashboard
These visualizations render high-density well and rock property data as 2D Scatter Plot and 3D Point Clouds in both flat and spatial views – ideal for visualizing clusters, distributions, and anomalies
The RubberBandXyZoomModifier has been enhanced with support for directional zooming. A new property, XyDirection, allows developers to configure zoom behavior along the X-axis, Y-axis, or both. This update provides greater flexibility in user interaction, particularly in use cases where vertical-only or horizontal-only zooming is required, such as geological cross-sections, stock charts, or vertically stacked data views.

The StackedColumnRenderableSeries now offers full support for the PaletteProvider API, including compatibility with custom IFillPaletteProviders implementations and WPF Gradient Brushes when using Visual Xccelerator Engine. This enhancement enables rich, data-driven coloring of stacked columns – ideal for highlighting thresholds, value ranges, or custom segmentation using gradients or dynamic brush logic.

A new property, ZoomExtentsRange, has been added to the IAxis interface and is now supported by all axis types. This property allows developers to specify a custom IRange that will be applied as the VisibleRange when a Zoom to Extents operation is triggered. It provides fine-grained control over zoom behavior: for example, ensuring consistent axis limits or preserving buffer space around the data when zooming to extents.
The Home View of the SciChart WPF Examples Demo has been redesigned to match the modern layout of the SciChart JS Demo. This update introduces a Tree View navigation panel alongside example preview images, making it easier and more intuitive to explore and discover relevant examples quickly:

Full list of changes for this and previous updates can be found at the SciChart WPF Changelog.
SciChart WPF v8.9 is available by:
We welcome your feedback! Please let us know what you think about our new features, examples and improvements. You can contact our friendly, helpful team at any time!
Related Posts
![]()
Queens Award for Innovation
Proud winners of the Queens Award for Innovation, 2019. Awarded on account of our innovative graphics engine which underpins the SciChart library and enables our world-beating charting performance
![]()
National Business Awards
Highly Commended for Lloyds National Business Awards, 2019. Awarded on account of our innovative graphics engine and impressive customer base
![]()
National Technology Awards
Awarded “Healthcare Tech of the Year” at the 2025 National Technology Awards – a top UK recognition for breakthrough innovation in technology.

Reviews
SciChart has received hundreds of verified, 3rd party reviews