DirectX Compatibility in WPF Charts with SciChart
SciChart now features an optional DirectX10 based renderer. This is currently included as an add-on to the SciChart High Performance […]
We’ve moved over to a new format for communicating our releases and updates of our popular WPF Chart library, by publishing a rolling changelog of every fix or enhancement in SciChart.
You can find the changelogs in the top menu at Developers -> Changelogs -> SciChart WPF ChangeLog
This release (v8.11.0 build 28985) is a cumulative update with new features, fixes and enhancements, which is backward compatible to version 8.0 of SciChart WPF. It’s recommended for all users on v8.x to upgrade.
To find out what is new since v8.10, read on below:
SciChart WPF now includes a Polar Uniform Heatmap chart, designed for visualizing scalar data across polar coordinates, perfect for applications like antenna radiation patterns, circular thermal maps, and directional data analysis.
This feature is implemented via the new PolarUniformHeatmapRenderableSeries, which works seamlessly with the existing UniformHeatmapDataSeries. The heatmap spans both Angular (PolarXAxis) and Radial (PolarYAxis) axes, with XStep defining angular resolution and YStep setting the radial granularity. By default, the full data range maps to a complete 360° circle, but it can easily be resized to a sector view using VisibleRange on the Angular axis.
To showcase its capabilities, three new examples have been added to the SciChart Demo, illustrating advanced use cases such as:
This new chart type greatly enhances SciChart’s polar charting capabilities for scientific, engineering, and signal-processing domains.
This example showcases how to construct a Polar Uniform Heatmap for visualisation of 2D scalar field, composed of sinusoidal spatial waves with added noise, using SciChart. The heatmap accepts a 2D array of numerical values, where each element represents a data value at a given polar coordinate, defined by radius and angle.
The example highlights SciChart’s rich interactivity, including drag and mouse-wheel zooming and panning, chart and axis rotation, tooltips and data inspection and an interactive color map for dynamic styling.

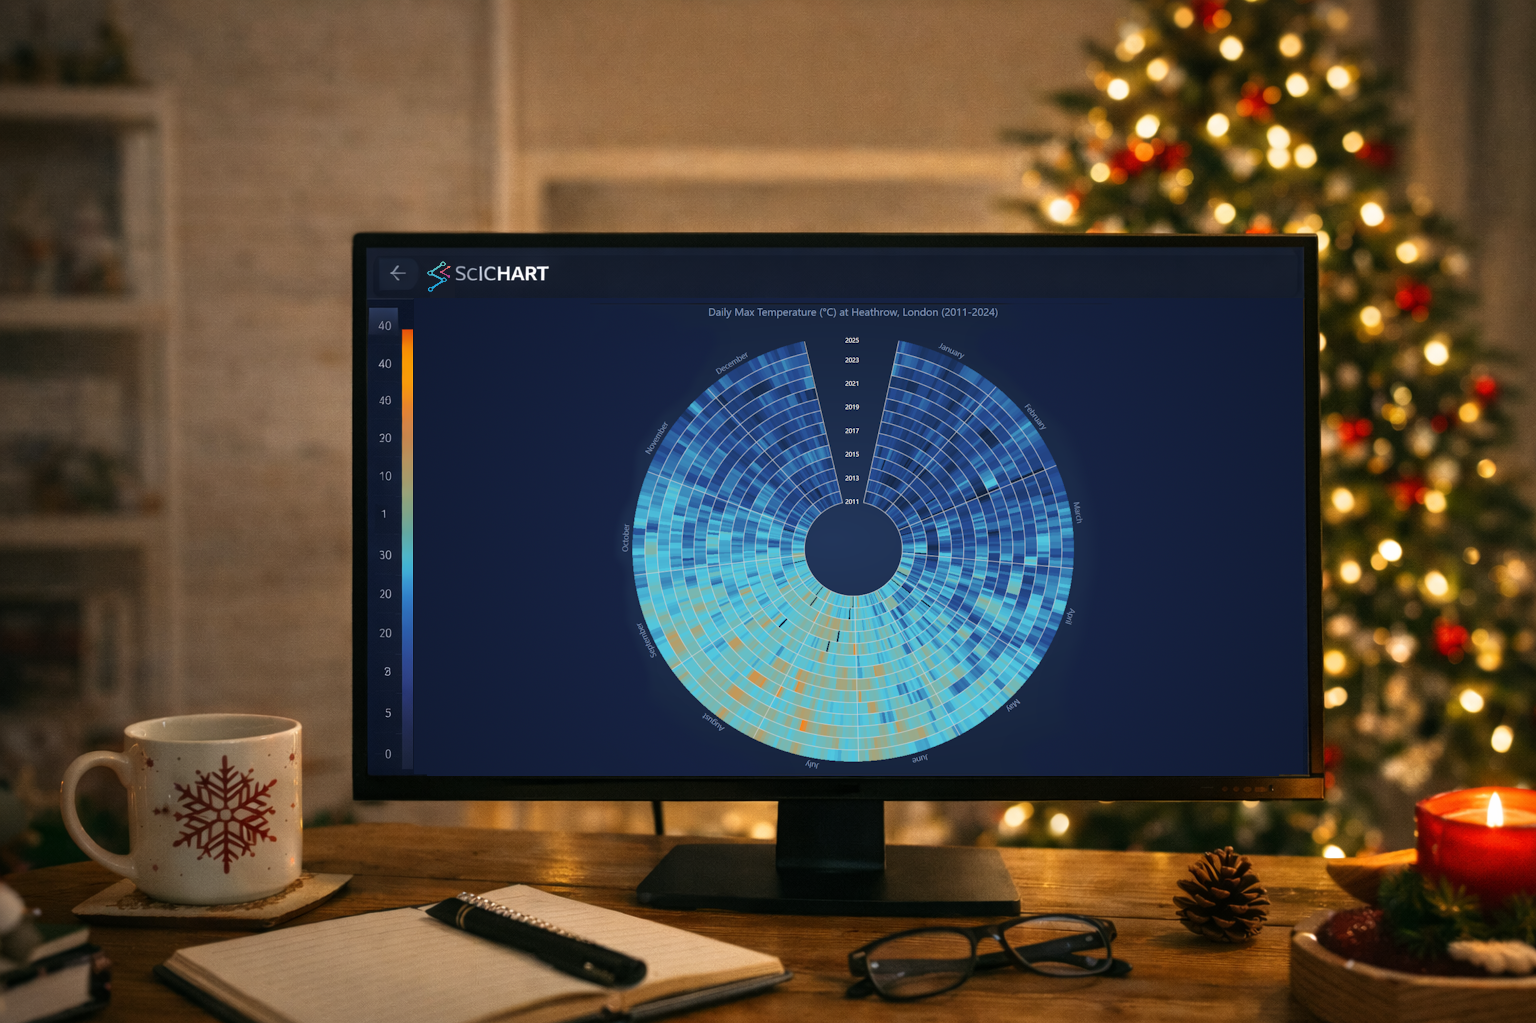
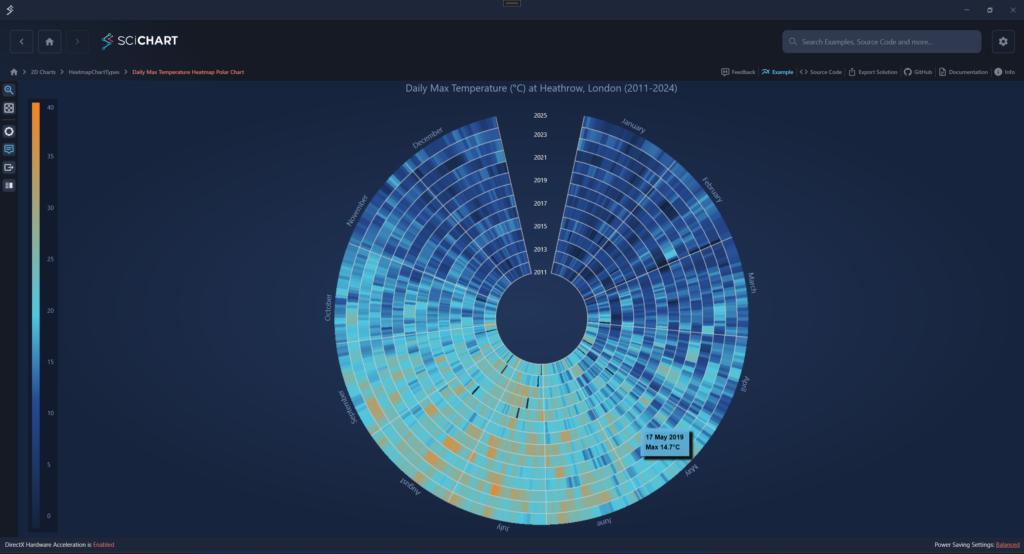
This example demonstrates how to create a Polar Uniform Heatmap using SciChart to visualize real-world maximum daily temperature data spanning multiple years. The chart presents long-term seasonal patterns and temperature trends in a visually intuitive circular layout. The heatmap is built from a 2D array, where each row represents a year and each column corresponds to a day within that year.
The Angular Axis displays the days of the year and is styled with sector-like grid lines to mark month boundaries, with month names placed at the center of each sector. The Radial Axis represents the sequence of years, segmented with concentric circular grid lines for clarity.
In addition to presenting time-based data in a compact and engaging circular format, this example highlights several advanced customization features. These include custom axis labels implemented using the LabelProvider API, grid lines rendered above the heatmap, enhanced tooltips, and a custom placement for the year axis. The heatmap itself is styled as a partially closed circle.
This example demonstrates how to construct a sector-shaped Polar Uniform Heatmap using SciChart to visualize ultrasound diagnostic data represented as a 2D numerical array. The dataset models a human embryo at a prenatal stage, captured during a medical ultrasound examination.
A user-defined grayscale Color Map is applied to convert raw data values into visually distinct shading, simulating the appearance of clinical ultrasound imaging.
In addition to rendering medical scan data, the example showcases Polar Chart configuration features such as sector-based layout, chart rotation, and the use of annotations to enhance the visual presentation.

Full list of changes for this and previous updates can be found at the SciChart WPF Changelog.
SciChart WPF v8.11 is available by:
We welcome your feedback! Please let us know what you think about our new features, examples and improvements. You can contact our friendly, helpful team at any time!
Related Posts
![]()
Queens Award for Innovation
Proud winners of the Queens Award for Innovation, 2019. Awarded on account of our innovative graphics engine which underpins the SciChart library and enables our world-beating charting performance
![]()
National Business Awards
Highly Commended for Lloyds National Business Awards, 2019. Awarded on account of our innovative graphics engine and impressive customer base
![]()
National Technology Awards
Awarded “Healthcare Tech of the Year” at the 2025 National Technology Awards – a top UK recognition for breakthrough innovation in technology.

Reviews
SciChart has received hundreds of verified, 3rd party reviews