WPF vs Avalonia: Which Is Best in 2026?
Discover whether WPF or Avalonia XPF is the right choice for your high-performance data visualization needs in 2026.
Many developers start with open-source charting tools, like Chart.js or Plotly. But as data volumes grow and performance demands rise, “free” often starts to cost more than you expect.
At SciChart, we are big fans of open-source. We use open source in some of our chart controls, such as FreeType (an open-source text shaping library), Rene Schulte’s well-known WriteableBitmapEx (for line drawing in WPF), WordPress/PHP on the website and more.
We’ve written and shipped scichart-react and scichart-angular, both open-source libraries allowing you to use SciChart.js in popular JavaScript frameworks. Open source is part of how modern software gets built: we use it, build on it, and contribute back when we can.
However, we do often get asked the questions ‘is your software free?’ and ‘why should I buy SciChart vs. open-source chart component?’
SciChart isn’t anti-open-source – it’s built on it – but the question is “When does free become expensive?” If you reach a certain level, requiring advanced interactions, customizations and pushing the boundaries of performance, the free library may eventually slow your team down, and prove more expensive in the long-run than a paid chart library.
In this article we compare our software vs. a few popular free chart libraries and share practical situations where teams tell us SciChart made their work easier compared to open source, free charts for your WPF, JavaScript, iOS and Android applications.
This first reason almost goes without saying. One of the biggest advantages of using a commercial WPF, iOS, Android or JavaScript chart library simply having a dedicated enterprise technical support when you need it. If charts are mission-critical to your project, and resolving any issues promptly is important to you, it’s a strong reason to consider a commercial chart control such as SciChart’s chart library.
For scalable success, a chart library backed by a dedicated team offers superior support, a smoother development experience, and minimizes the time and effort required for updates.
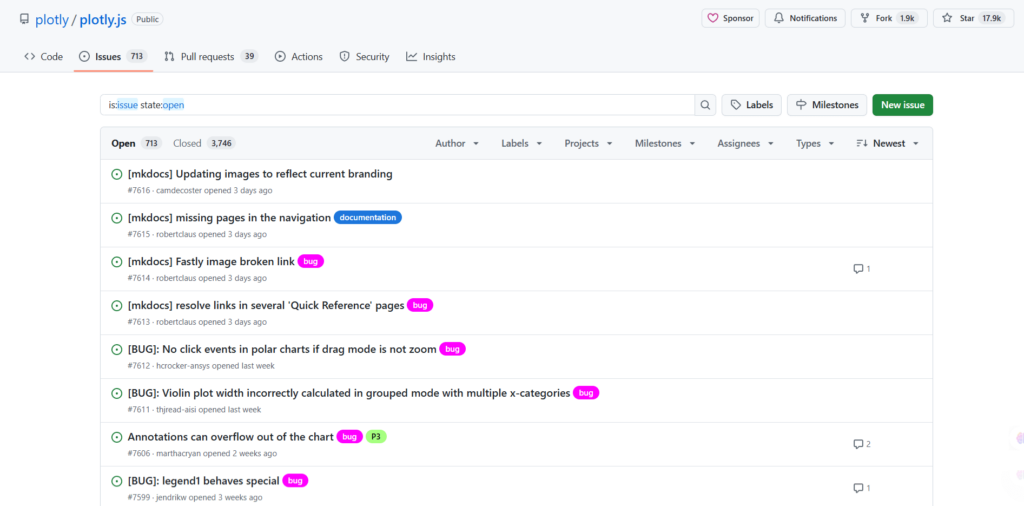
The following table shows the reported open issues on four major open-source chart projects: OxyPlot, LiveCharts (WPF Charts), MPAndroidChart (Android Charts) and Charts (iOS). New questions are asked every day on the GitHub repositories for these libraries, and many are unanswered.
| Open source project | Number of open issues | Commits per week |
| OxyPlot (WPF Charts) | 553 open issues | The most recent commit is several months old. |
| LiveCharts (WPF Charts) | 514 open issues | Several commits per week, with 400 commits since the last release. |
| MPAndroidChart (Android Charts) | 1983 open issues | Sporadic, minor updates, no regular commits fulfilled |
| Charts (iOS Charts) | 789 open issues | ~1 to 2 commits per week |
| SciChart (JavaScript, WPF, iOS, Android, Xamarin Charts) | Over 12,000 support incidents and 4,000 forum questions were resolved. | Daily (full-time team offering continuous enterprise-grade updates) |
| Plotly (JavaScript Charts) | 707 open issues | ~3-4/week (Heavy backlog on performance-related issues) |
| Chart.js (JavaScript Charts) | 400 open issues | ~6-7/week (Active, but small core team) |
| eCharts (JavaScript Charts) | 1,200 open issues | ~15-20/week |
Table 1: Open issues on popular open source chart components
One X (formerly Twitter) influencer described the flood of open source help requests as ‘the fire-hose of open source’: When your open source chart library becomes popular you will be flooded with requests from users asking for help, demanding bug fixes and features, and it can quickly become unsustainable to handle them.
So, the open-source developers quite rightly stop answering. Even we sometimes find it difficult to answer as many support requests as we do: over 12,000 support tickets and 4,000 forum questions to date. This is our job – I can’t imagine having to do this level of work in my spare time.
If you use an open-source chart control in your business-critical project and one day you need help, and Stack Overflow or the community is unable to provide it, you will be stuck. This could cost your business time and money if your application development is delayed if your productivity is affected while trying to find a solution.
SciChart’s 5-star rated Enterprise tech support, and SciChart AI, is a safety net against problems you might encounter during your project. Our tech support is not meant to be a replacement for Google, or research, but if WPF, iOS, Android or JavaScript charts in your project are mission-critical to your business, at some point you may encounter a problem or issue that needs our team to help you. This can save you time and money to get back to what you are supposed to do: developing your application.
For mission-critical software, waiting days or weeks for a GitHub response isn’t an option – predictable support equals predictable delivery.
The level of technical support you receive from a paid library rather than an open-source library is not to be underestimated. With 15 full-time developers, SciChart is able to regularly respond to the influx of requests across myriad channels (forums and support requests).
We not only maintain platform support, but also invest in reducing friction by maintaining extensive docs, live examples, and a searchable AI assistant that cut support tickets before they occur.
Our motivation for compiling and maintaining this documentation? The better the resources and more easily accessible they are, the fewer direct support requests we have to handle!
The level of technical support available helps keep SciChart performant, stable, and straightforward to work with. It also makes it easier to find answers quickly and ensures the library remains reliable in demanding situations.
Ultimately, it’s a time-saver for developers, which in turn saves on costs.
Technical support isn’t the only reason to choose SciChart vs. an open-source chart component. If an API or library is productive and easy to use, it can lead to bigger cost savings than those provided by tech support.
Think about the time to get started, learn the API and to find information you need on the web. If you have a requirement that is not simple, you might need to do some research to find the answers. With SciChart, the amount of time and resources you’d save quickly adds up in value.
Example:
It’s quite reasonable to assume you might save an hour per week when using SciChart vs. an open-source chart component. More if your project is chart heavy. An hour per week adds up to 48 working hours per year, or 5 days of developer time: much more than the cost of the license.
One of our customers left the following review:
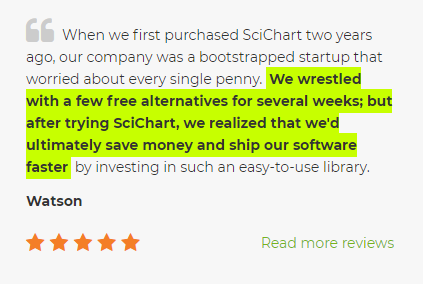
This review is particularly interesting because the author spent several weeks evaluating free alternatives before choosing SciChart. Free software can come with a cost of your time, and although SciChart is a commercial control, meaning initial cost to your team, the care and attention that has gone into the API, examples, documentation and online help resources such as tutorials and forums will lead to faster development of the application and cost savings in the long run.
Any developer that has created custom code from scratch knows that it can be very difficult (and time-consuming) to maintain. That’s where the backing of a full-time team that produces bug fixes, changelog updates, and documentation is essential.
We have noticed that the development activity of many of the popular open source chart controls has declined over time, however, the demand for features and improvements has increased with their popularity.
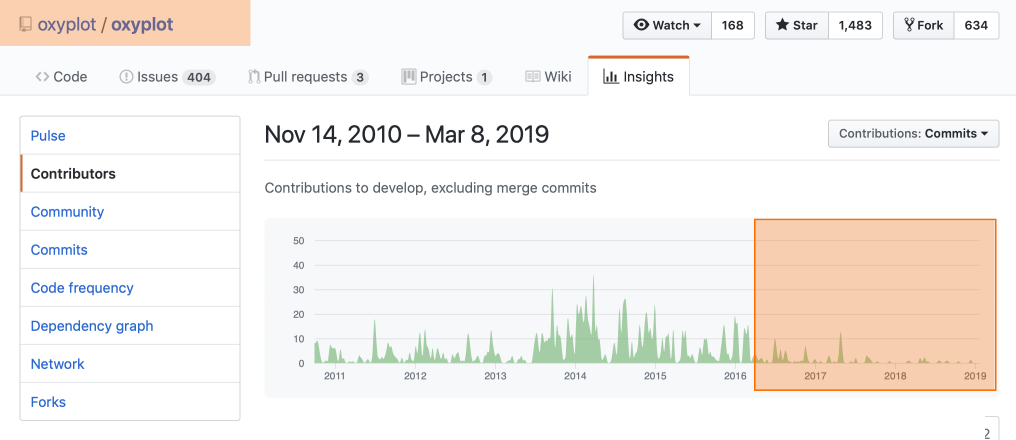
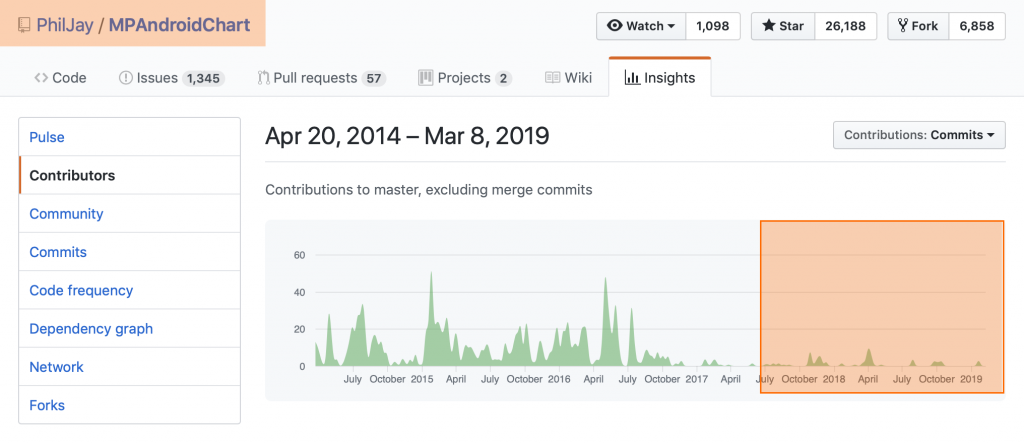
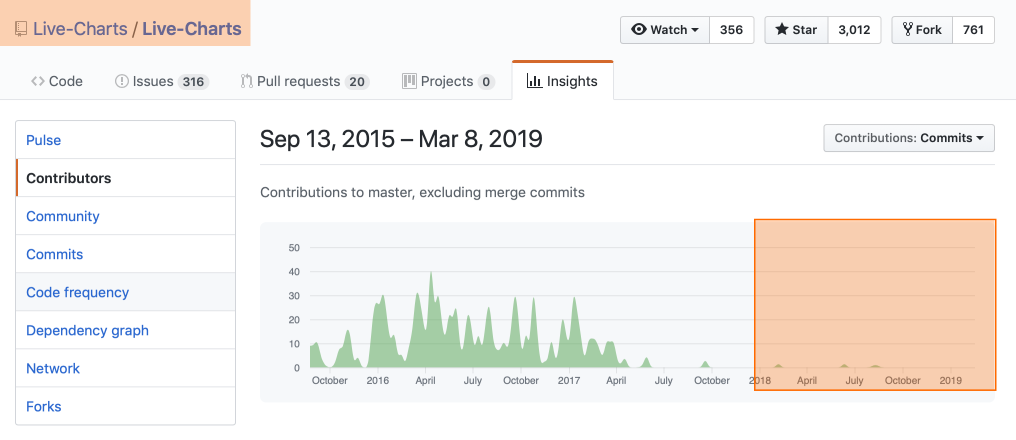
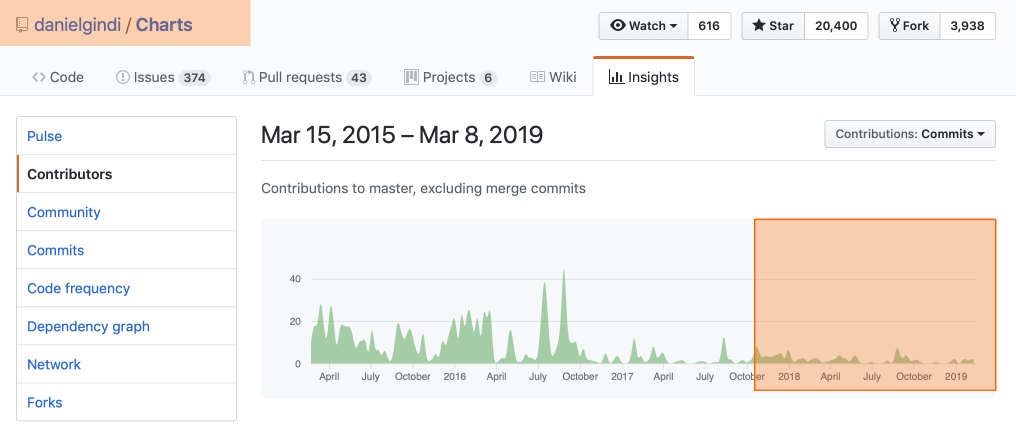
Above you can see the GitHub activity of the four main open source chart components.
Below you can see our GitHub activity. In contrast to the open source projects listed above, our development activity has increased. In fact, over the past two years it has really heated up with daily new feature requests and demand for more improvements, better performance, compatibility with a new framework etc…
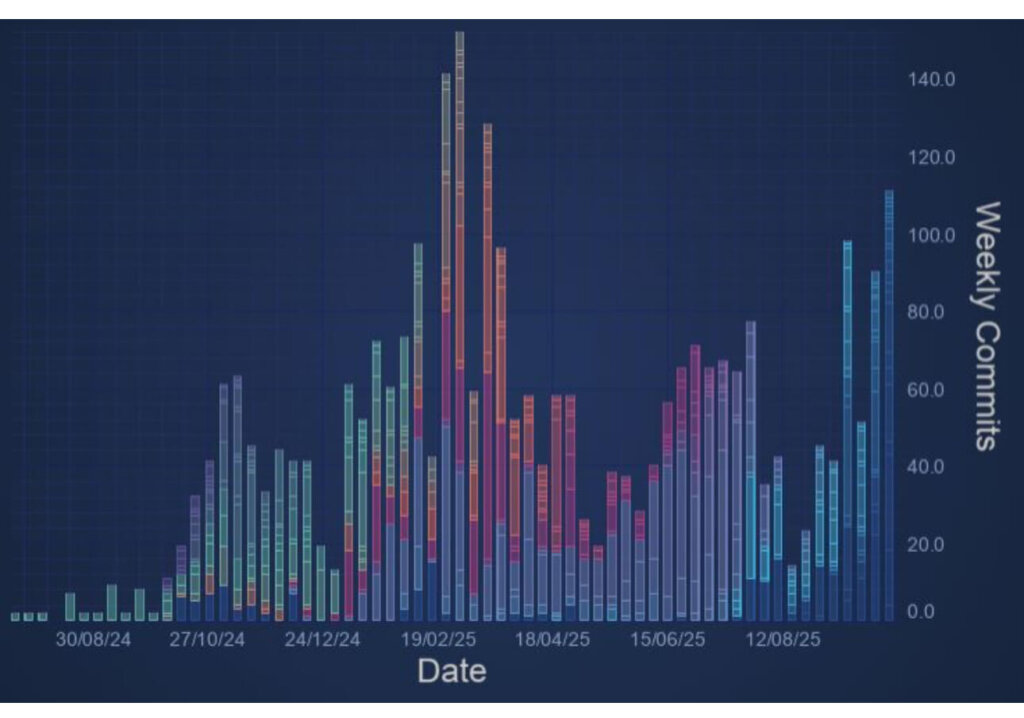
When SciChart started in 2012, we thought, “How hard can plotting X,Y values on a screen really be?” More than a decade and 15 full-time developers later, we’re still improving it every day, proof that great charting is anything but simple.
So what does this mean for you?
If new React versions, Angular versions as well as .NET, Xcode, iOS, Swift or Android SDK is released then both commercial and open-source charts have to be updated to be compatible. Sometimes a new device comes along and an application doesn’t work. Sometimes, a critical bug occurs since an operating system or framework update and the chart component has to be fixed.
An example includes Google Play store recently introducing the 16kb page size limitation. Our team patched and deployed a version quickly so that our users could continue deploying apps to the Google play store.
The same occurs on the web: new standards, new versions of TypeScript, new versions of React, Angular, Vue, Next.js, Nuxt.js, Electron or Tauri are continually being released.
SciChart is backed by a team of 15 full-time developers focused on maintaining platform compatibility, new feature development and fast issue resolution.
There is a risk you take when using any free open-source or commercial chart control that the developer ceases to update their software. However, with SciChart that risk is minimized since our developer activity and popularity has increased over time.
When bugs are reported in our WPF Charts, iOS and Android Charts or JavaScript Charts we aim to fix the serious ones as fast as possible, because they directly affect our customers, and therefore us.
Open source is a cornerstone of modern development, and we appreciate the work of those who maintain it. At the same time, keeping SciChart fast, reliable, and continuously improving requires full-time commitment from our team. Licensing simply makes that sustainable – it lets us focus on quality, responsiveness, and the long-term success of the developers who rely on us.
Our long-term focus on charting has naturally led to a deeper feature set in certain areas compared to what’s typically available in open-source or multi-purpose commercial libraries.
Take a look at the features matrix below to see what features SciChart can bring which open-source components do not.
| Feature | SciChart | Plotly.js | eCharts | Chart.js |
| 2D Plots | ✅(Advanced chart types available, including polar charts and GeoJSON Maps) | ✅ | ✅ | ✅ |
| 3D Plots | ✅ | ✅(Only supports 3D charts if large JS files are used) | ✅ (by importing eCharts-gl) | ❌ |
| Active, Searchable Forums | ✅(Dedicated forums and support) | ✅ | ✅(Primarily GitHub and Reddit) | ✅ (Primarily StackOverflow) |
| Animation of Data | ✅ | ⚠️(Basic animations) | ✅ | ✅ |
| Annotations on Chart | ✅ | ⚠️(Limited options) | ✅ | ⚠️(Requires plugin) |
| Custom Series | ✅ | ⚠️ (Limited options) | ⚠️ (Limited options) | ⚠️ (Limited options) |
| Custom Zoom or Pan Behaviors | ✅ | ✅ | ✅ | ✅(Requires plugin) |
| Export / Print | ✅ | ✅ | ✅ | ✅ |
| Fully Documented | ✅ | ⚠️(Limited documentation) | ✅ | ✅ |
| Hardware Acceleration | ✅ | ⚠️ (WebGL with limit of 8 charts per page) | ⚠️ (Only 3D charts benefit from WebGL, 2D are canvas/svg) | ❌ |
| High Performance & Real-time | ✅ | ❌ (SciChart.js is up to 100x faster than Plotly.js) | ❌ (SciChart.js is up to 100x faster than eCharts) | ❌ (SciChart.js is up to 200x faster than Chart.js) |
| Link Multiple Charts | ✅ | ❌ (Plotly.js does not support crosslink without workarounds) | ✅ | ⚠️ (Possible with workarounds) |
| Legend Customization | ✅ | ⚠️ (Basic legend styling) | ✅ | ✅ |
| Logarithmic Axis | ✅ | ✅ | ✅ | ✅ |
| Multiple X-Axis | ✅ | ⚠️ (Limited) | ✅ | ✅ |
| Multiple Y-Axis | ✅ | ⚠️ (Limited) | ✅ | ✅ |
| Per-Point coloring | ✅ | ✅ | ✅ | ✅ |
| Programmatically Change Viewport | ✅ | ✅ | ✅ | ⚠️ (Requires plugin) |
| Technical Support | ✅(Dedicated support team) | ❌ | ❌ | ❌ |
| Theme or Template Customization | ✅ | ⚠️ (Limited customizations) | ✅ | ⚠️ (Less granular than other chart libraries) |
| Tooltips | ✅ | ✅ | ✅ | ✅ |
| Touch Interaction | ✅ | ✅ | ✅ | ⚠️(Requires plugin) |
| Zoom & Pan | ✅ | ✅ | ✅ | ⚠️ (Requires plugin) |
Table 2: Feature comparison of SciChart vs. popular Open-Source Chart components
The open-source charts are, in many cases, good enough for simple applications. If you want to just add a few low point-count 2D charts to your application, they can do the job. However, it’s the depth of features where SciChart really shines.
The chart above may tick a lot of boxes for features, but it doesn’t show the full picture.
For instance, even if Plotly offers 3D charts, this only works if you introduce all the modules which increase the bundle size to almost 5MB.
Some open-source libraries support only line, scatter, bubble charts and histograms with sorted data in the X-direction, which really limits your options. Meanwhile, SciChart has full hardware acceleration for 2D/3D chart types, as well as things like polar charts, polar heatmaps, GeoJSON maps, and extensive financial charting options.
On top of this, you have unmatched levels of customization, with every API endpoint being customizable, and optimizations for high-throughput, real-time streaming for interactive charts – something which open-source chart libraries struggle with at scale.
What this means: SciChart delivers both breadth (2D, 3D, real-time) and depth (GPU rendering, custom APIs, multiple axes). Most free libraries stop at visualization, whereas SciChart supports full analytical workflows.
Most open-source or commercial chart controls for WPF, iOS, JavaScript, and Android provide the following standard features:
It would be easy to compare two chart libraries and see that they all support the above features and conclude ‘They’re the same’. Far from it.
With SciChart’s API, you will find complex customizations are possible on nearly everything. If we can’t support something, we give a workaround, or, accept a feature-request for future development.
Here’s a selection of some of the deep features that SciChart supports which allow greater flexibility when creating charting applications for business.
It’s really hard to consolidate these features, which provide excellent flexibility of our chart controls, into such a short list. These are just some of the flexibility options that SciChart has that open-source chart controls and even commercial chart vendors do not have. Deeper features and more flexibility means you can get more complex requirements done quickly, which adds up to big cost savings over time, and ROI for your team.
In short: with SciChart, if you can imagine it, you can build it – without hacking workarounds or waiting on pull requests.
There are plenty of reasons to choose SciChart, even if your application only needs to show modest dataset sizes. Some of our users have very demanding performance requirements, and SciChart is capable of drawing many millions of points, updating charts in real-time and providing a low memory and CPU footprint on all the platforms that we support (iOS, Android, Windows/WPF, and JavaScript).
We have created the fastest iOS charts and Android charts in the world, and one of the fastest, high-performance charts for WPF and JavaScript applications. Our charts are based on a hardware-accelerated rendering engine using DirectX (Windows), OpenGL ES (Android), WebGL (JavaScript), and Metal (iOS) so that you get the fastest charting possible in your applications.
What does this mean to you? It means that SciChart makes impossible projects possible.
We compared the performance of SciChart vs. some well known open-source chart components, and discovered that SciChart performs orders of magnitude faster than open-source libraries (See iOS Chart Benchmarks, Android Chart Benchmarks, and JavaScript Chart performance benchmarks). This means more data can be shown in your apps and previously impossible app ideas can now be realised.
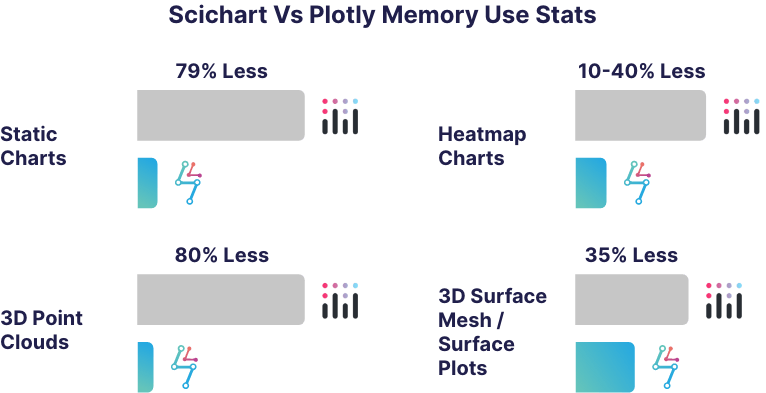
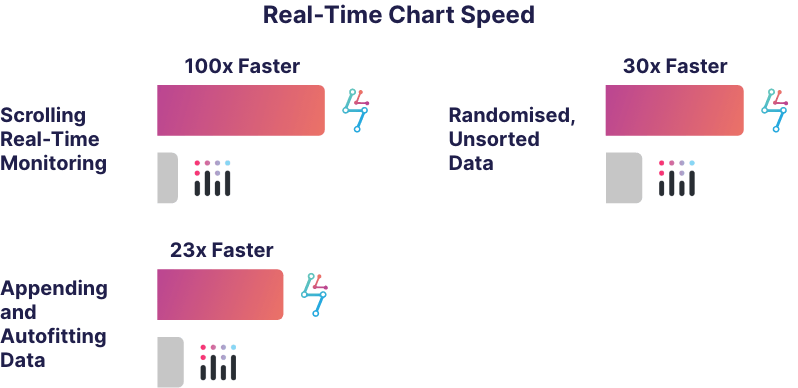
The above graphs show chart speed and memory use data when comparing SciChart with Plotly. SciChart is up to 100x faster than Plotly at rendering charts and also uses up to 80% less memory.
Our WPF Charts are also similarly fast compared to open-source charts. We are also working continually to make better gains in this area of performance and ensure that our charts are smooth and real-time in your applications.
Faster rendering doesn’t just look better, it enables real-time analytics, live dashboards, and responsive UIs that win users’ trust.
So, given all of the above, when should you choose SciChart vs. an Open-Source Chart component?
There are some good arguments above, but you will find some more in the article seven reasons not to use Open Source. Some which are cited include:
In the article Open Source: What they’re not telling you there is further discussion to decide when to choose open source vs. a proprietary vendor.
When the requirement complexity is large, or the application is business critical, or when features or performance matters and you need a component which is actively developed, SciChart is a proven choice for enterprise applications.
Using a third-party chart component is more efficient than building one from scratch, saving your team months in planning, development, and testing. It can be considerably cheaper and more effective in the long run than using an open-source library, where you will be responsible for the maintenance or issue fixing should a problem arise that hasn’t been resolved by one of the open-source maintainers.
For many organizations, especially larger ones, the hidden cost of maintaining and securing multiple open-source dependencies internally can be significant. Keeping those libraries compatible, patched, and up to date often requires dedicated engineering resources. SciChart offers a maintained, performance-optimized alternative with predictable costs and structured support – allowing teams to focus on building their products, not maintaining their tooling.
To give a general indication of the potential return on investment when purchasing SciChart, we’ve included an example ROI calculation below. If you consider the number of developers on your team, and the developer rate, you can get an idea of the cost for your team’s time.
Next, estimate the time saved per developer per month. For example, conservatively estimating 1-hour a week saved from productivity, you might arrive at a figure of 4-hours per month. The actual figure could be higher in applications which are charting-heavy.
Finally, estimate the number of support incidents per year. Support incidents which are serious are rare, perhaps you will only get one or two a year. However, each one might block your team for a long time if not resolved. So for example, estimate 2 days per year, but 16 hours of time lost per incident.
The calculator will output the return on investment for your purchase.
These are the results:
| Number of developers on team | 5 |
| Developer rate / hour | $60.00 |
| Time saved (general productivity) per dev per month | 4 hours |
| Time saved (general productivity) entire team per year | 240 hours |
| Cost saved getting started / finding information / Year | $14,400.00 |
| Number of critical support incidents / year | 2 |
| Time saved for each critical support incident | 16 hours |
| Cost saved for critical support incidents | $1,920.00 |
| Number of minor support incidents / year | 10 |
| Time saved for each minor support incident | 4 hours |
| Cost saved for minor support incidents | $2,400.00 |
| Single SciChart License Cost | $1099 |
| Multi-Purchase Discount | 30.00% |
| Cost of 5x SciChart Licenses for your team | -$3,846.50 |
| Total productivity costs saved | $18,720.00 |
| ROI ($) | $14,873.50 |
| ROI (%) | 387% |
Table 3: Estimated cost savings for a 5-developer team using SciChart
Of course, cost savings depend on many factors and the above doesn’t include the time you will spend learning the SciChart API, however we believe it will be quicker to learn SciChart than an alternative charting API (thanks to the AI charting support).
Download the ROI Calculator here as an Excel Spreadsheet if you want to play around with the numbers. We have included both single-developer licensing costs vs. ROI as well as site-license costs vs. ROI.
SciChart is licensed as a perpetual license with royalty free redistribution rights (see Licensing FAQ) and a support and updates subscription. The subscription is not mandatory after 1-year – you can still use SciChart after the support subscription ends, but you won’t be able to access technical support or updates / bug fixes to the chart (see Renewals FAQ).
We offer discounts for multi-year licenses of 50% for the 2nd and 3rd year if agreed up front.
Finally, you can, if you want, purchase the source-code to SciChart. If you want to modify it, then you have one of the main benefits of open source: ability to inspect, modify and develop the source-code of the chart control.
About SciChart: High Performance Real-time Charts
SciChart isn’t a side project – it’s a product developed and maintained full-time by a dedicated team.
With over 15 years of continuous improvement, we focus entirely on delivering stability, accountability, and progress. This commitment allows us to respond quickly to issues, release regular updates, and evolve the library based on real developer feedback.
It is our goal to create the best cross-platform WPF, iOS, Android and JavaScript 2D and 3D charts in the world, focusing on performance, developer productivity, ease of use, depth of features and enterprise-grade tech support.
Open-source charting tools are excellent for experimentation and learning, but when reliability, performance, and long-term maintenance matter, “free” can become costly. SciChart provides a future-proof foundation, built by a full-time team, optimized for real-time performance, and backed by responsive enterprise support.
If you have a question about what SciChart can offer you, or if you would like to get a quote, please contact us. Our expert support team will be glad to help.
Recent Blogs
![]()
Queens Award for Innovation
Proud winners of the Queens Award for Innovation, 2019. Awarded on account of our innovative graphics engine which underpins the SciChart library and enables our world-beating charting performance
![]()
National Business Awards
Highly Commended for Lloyds National Business Awards, 2019. Awarded on account of our innovative graphics engine and impressive customer base
![]()
National Technology Awards
Awarded “Healthcare Tech of the Year” at the 2025 National Technology Awards – a top UK recognition for breakthrough innovation in technology.

Reviews
SciChart has received hundreds of verified, 3rd party reviews