SciChart for Avalonia XPF v2.0 Released!
SciChart is thrilled to announce the release of SciChart for Avalonia XPF 2.0 – a major update that brings all features and improvements […]
In these unprecedented and unusual times we are pleased to announce to you that we are not only still operational, but also delivering new features & updates to our users and today have a release of SciChart Mobile SDK v3.1!
This release brings you some long-standing features requested by our users via the Feature Request portal, and some showcase demos of how to use SciChart iOS, Android or Xamarin in medical or scientific context.
A full list of what’s new can be found below.
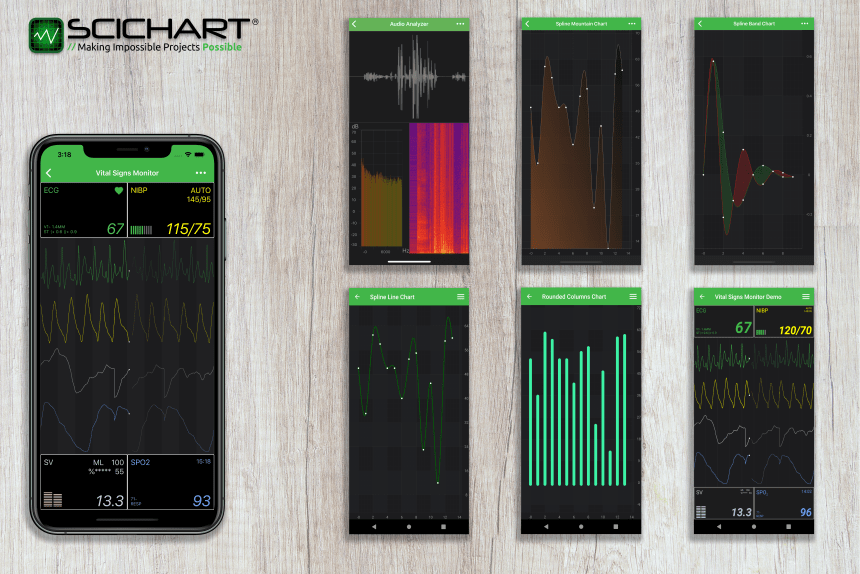
Formerly part of the SciChart showcase, we have created and updated our Vital Signs (ECG/EKG) demo showing how to use SciChart’s iOS, Android or Xamarin charts in a medical context.
Four channels of data are simulated, showing how SciChart iOS/Android can be used to draw real-time, high performance ECG/EKG charts & graphs to monitor blood pressure, SPO2 blood oxygen, and volumetric flow enabling you to create medical apps using an iPad or iPhone device.
SciChart helps you shortcut development of medical applications by providing rich, real-time, high performance & reliable iOS charts for use in Vital-signs monitors, blood pressure monitors, Electro-Cardiogram, medical Ventillators, patient monitors, digital stethoscopes, medical testing devices and more.
If you are creating an app that needs to visualize body temperature, pulse rate, respiration rate, blood pressure, or similar, choose SciChart to shortcut your development time & get to market faster with our well-tested, reliable
iOS/Android/Xamarin Chart library.
Another demo we’ve created is the Audio/Radio Frequency Spectrum Analyzer demo.
The Audio analyzer demo showcases how to use SciChart iOS (android) charts in a scientific context. Download the examples and enable your microphone to see this demo at work.
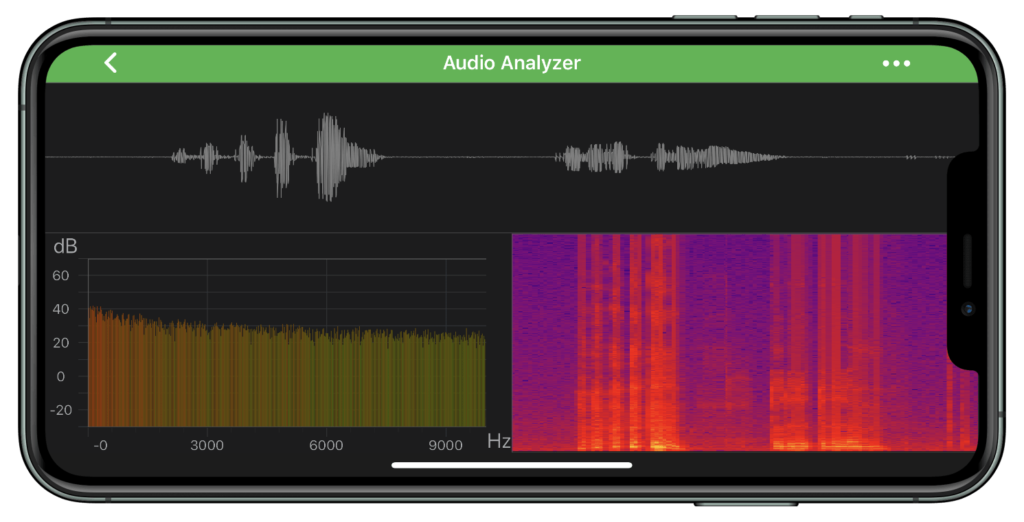
In this example we listen to the microphone on your iOS/Android device and create a waveform of the sound recorded in the top chart. This chart has 500,000 data-points drawn in real-time on our High Performance charts. The example application then performs a Fourier Transform, creating a spectral / frequency analysis of the audio waveform and plots in the lower left chart. Finally, the histogram of the fourier transform, known as a spectrogram, is plotted in a SciChart iOS Heatmap control in the bottom right of the example.
If you are creating an app that needs to visualize scientific data from data-aquisition devices, audio spectra, or visualize radio frequency or spectrial analysis choose SciChart to shortcut your development time & get to market faster with our well-tested, reliable iOS/Android Chart library.
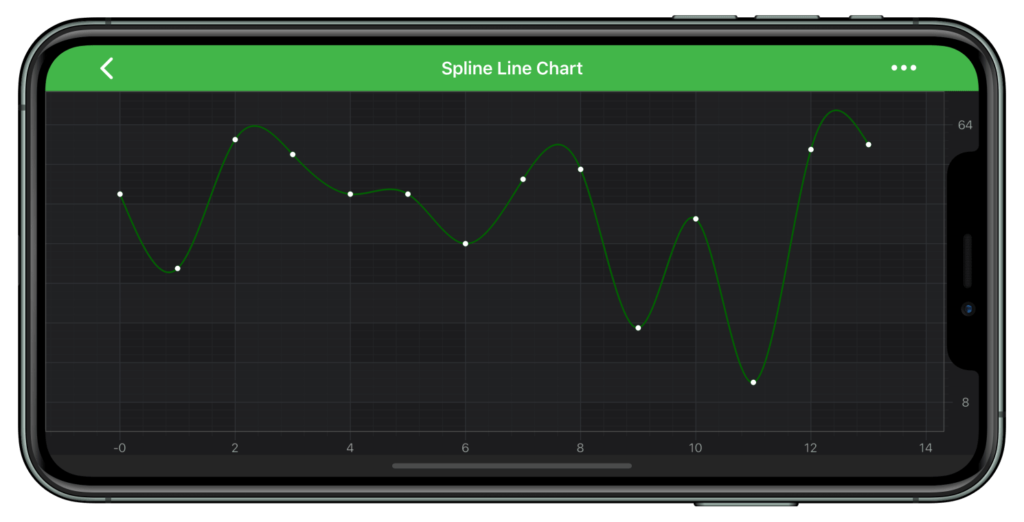
SciChart iOS & Android now features a native spline-line (smoothed line) series. Given a few number of points, our customers wanted to see smoother charts out of the box with spline smoothing / bezier interpolation between data-points.
SciChart Mobile SDK v3.1 features a spline line series which provides aesthetically pleasing, high performance smoothed line charts for iOS or Android apps.
Performance is excellent thanks to our intelligent, dynamic smoothing, and interactive frame rates with point counts in the 100,000 or even millions of data-points are still possible.
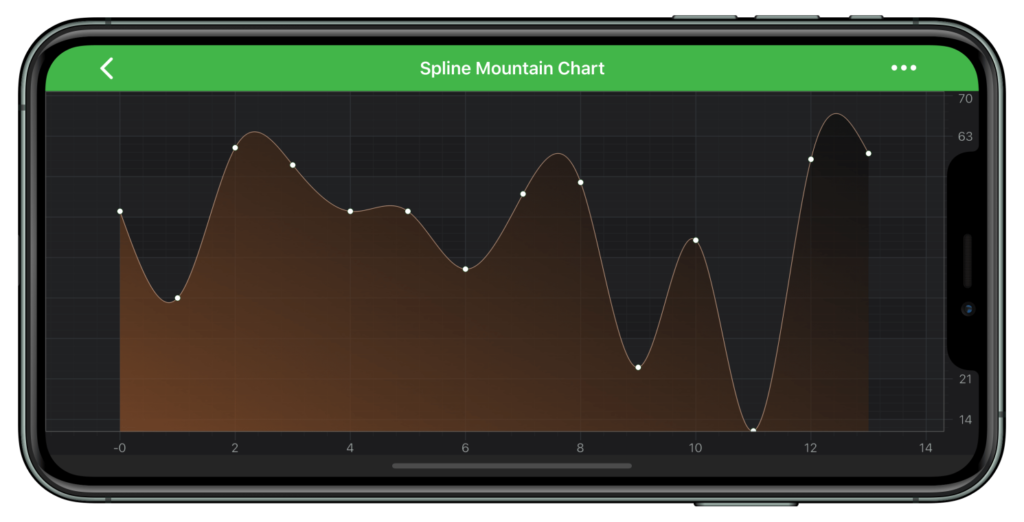
SciChart Mobile SDK v3.1 now features a spline mountain or area series which provides aesthetically pleasing, high performance smoothed mountain/area charts for iOS or Android apps.
Again, performance is excellent thanks to our dynamic smoothing and this chart type allows interactive frame-rates into the hundreds of thousands of points.
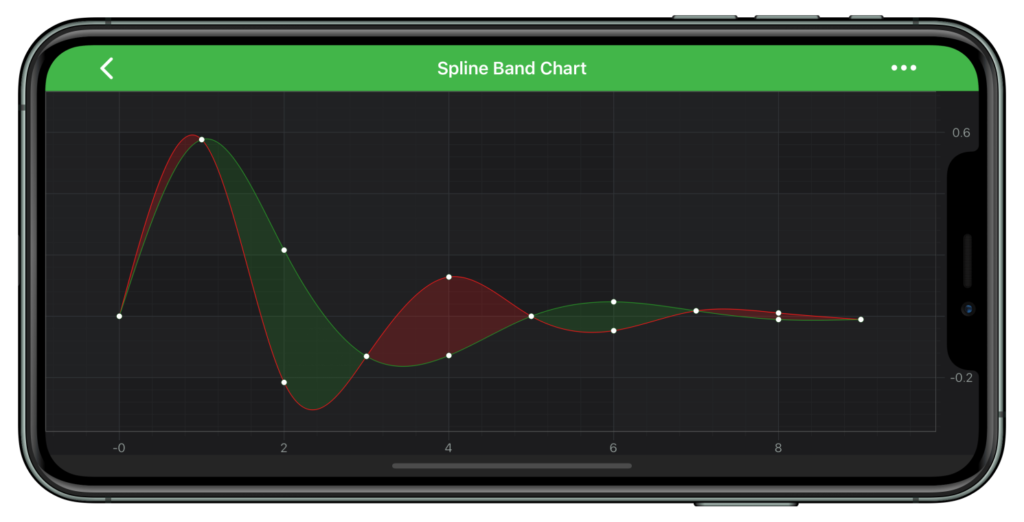
We’ve also added a spline band series natively which provides aesthetically pleasing, high performance smoothed band / high-low fill charts for iOS or Android apps.
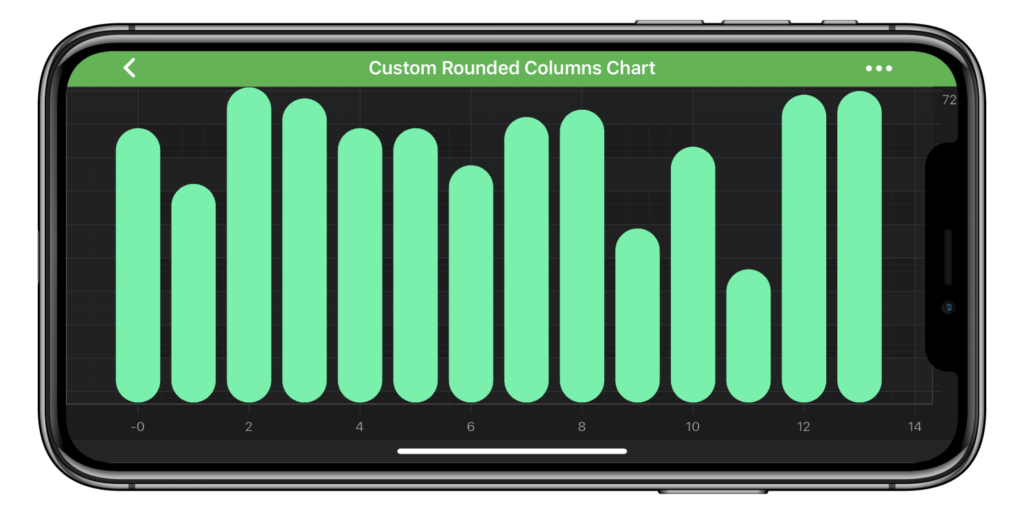
Column charts with rounded top/bottom have been requested via our Feature-request system. We haven’t build this feature natively but what we’ve done is used it as an example to showcase our powerful Custom Series API, which allows you to create any series type using a fast drawing context.
Since v3.0 of SciChart for Mobile, we have fixed a number of bugs & issues reported to us by customers over the past 3 months. These are listed below.
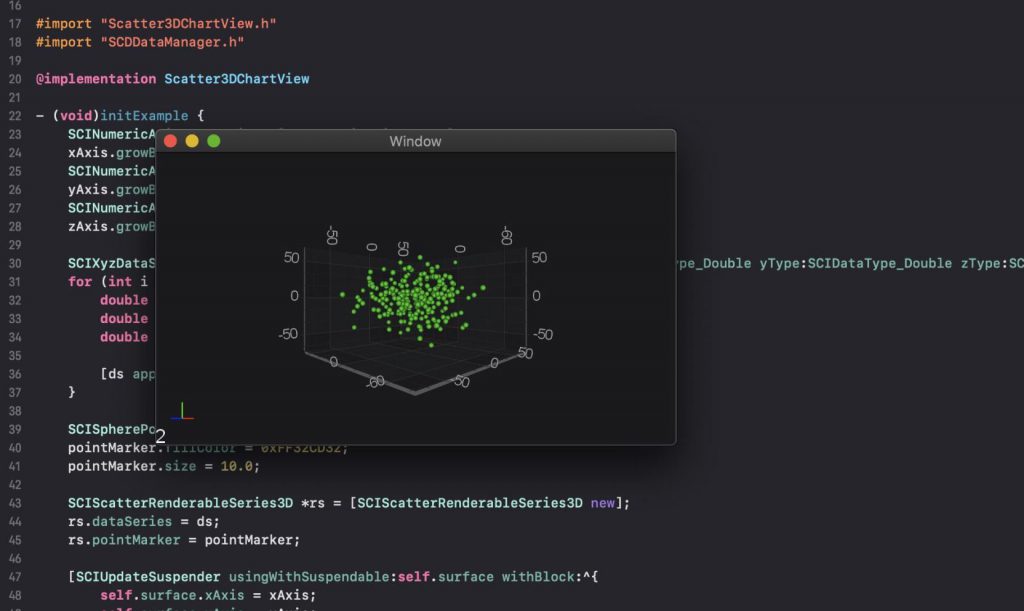
We announced recently on our Twitter and Linked-In page that we are making steady progress toward making SciChart available on Mac OSX. The codebase and API will be shared with iOS, and we will support Objective-C, Swift apps built for MacOS desktop computers.
More info on this coming soon. Subscribe to our newsletter by registering with SciChart to be notified when we release!
The SDK is now available at www.scichart.com/downloads. You will need to create an account at scichart.com/login in order to access this page. These SDK zips contain:
Separately you will need to download the Cross Platform Licensing Wizard, required to activate and license SciChart Mobile SDK v3.
We have prepared getting started pages for each platform, which you can view below.
The new SciChart Store has now been launched, and can be viewed at scichart.com/buy-now. You can buy online with credit card and our automated system will issue licenses immediately. For enterprise sales and purchase orders, please contact us and we will be glad to help!
Best regards
[SciChart Team]
Related Posts
![]()
Queens Award for Innovation
Proud winners of the Queens Award for Innovation, 2019. Awarded on account of our innovative graphics engine which underpins the SciChart library and enables our world-beating charting performance
![]()
National Business Awards
Highly Commended for Lloyds National Business Awards, 2019. Awarded on account of our innovative graphics engine and impressive customer base
![]()
National Technology Awards
Awarded “Healthcare Tech of the Year” at the 2025 National Technology Awards – a top UK recognition for breakthrough innovation in technology.

Reviews
SciChart has received hundreds of verified, 3rd party reviews