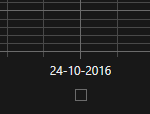
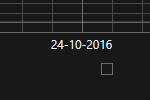
When I used SciChart 3.6, the labels closest to the edges of the chart would be drawn centered-below the grid line. Like all other tick/gridline labels are drawn. After I upgraded to SciChart 4.0 the labels are drawn inside the chart area and they disappear when the tick/grid line is outside the visible range. I searched for a setting/property in the documentation to get the behaviour as it was in SciChart 3.6, but I was unable to find this setting.
Is there a setting/property to get the behaviour as it was in SciChart 3.6?
3.6:

4.0:

- _ _ asked 8 years ago
- last edited 8 years ago
- You must login to post comments
Hi Steffan,
Thanks for your question. You are right, the behavior has been changed to the current one in SciChart v4.0. It is configurable though. You can switch it off and revert to the previous behavior setting AutoFitMarginalLabels to False on Axes (it’s True by default).
Hope this helps,
Best regards,
Yuriy
- Yuriy Zadereckii answered 8 years ago
 Excellent. Thank you :)
- You must login to post comments


