Hi,
I am displaying some charts on the screen (4 per screen). When I double click one chart, it opens in another, modal window.
I have the below problem with the tooltip modifier and the rollover modifier (one is enabled at a time, tried with both, need the fix at least for the tooltip modifier)
When I close the window, the following happens, to the chart that was double clicked:
1- If the chart is a simple column chart, the tooltip modifier does not work as soon as the maximized window is closed. Nothing happens when I move the mouse. I found a simple workaround, which is to zoom in/out even very little, and the modifier works back. Here I’m forcing it by code:
private void ChrtSurface_OnMouseDoubleClick(object sender, MouseButtonEventArgs e)
        {
            //Get the chart from the sender tag
            var surface = (SciChartSurface)sender;
            var chart = (SciChart)surface.Tag;

            //The chart is already executed, so no need  do that again. Start the single view form
            var form = new SingleChartView(new SingleChartViewModel(chart, this._viewModel.SelectedModule.Id));
            form.ShowDialog();

            ZoomChartToExtents(chart);
        }

public void ZoomChartToExtents(SciChart chart)
        {
            var scichartSurface = lstCharts.FindVisualChildren<SciChartSurface>().FirstOrDefault(x => x.Tag == chart);
            Dispatcher.CurrentDispatcher.BeginInvoke(DispatcherPriority.ApplicationIdle, new Action<SciChartSurface>(ZoomExtents), scichartSurface);

        }

        public void ZoomExtents(SciChartSurface chart)
        {
            chart.ZoomExtents();
            chart.ChartModifier.OnModifierMouseUp(new ModifierMouseArgs() { MouseButtons = MouseButtons.Right });
        }
2- If the chart is a stacked chart, I get a null reference exception. Here’s the exception:
“An exception of type ‘System.NullReferenceException’ occurred in Abt.Controls.SciChart.Wpf.dll but was not handled in user code
Additional information: Object reference not set to an instance of an object.”
And the stack trace (if zoom extents is not called):
at Abt.Controls.SciChart.Visuals.RenderableSeries.StackedColumnRenderableSeries.HitTestInternal(Point rawPoint, Double hitTestRadius, Boolean interpolate)
at Abt.Controls.SciChart.Visuals.RenderableSeries.BaseRenderableSeries.HitTest(Point rawPoint, Double hitTestRadius, Boolean interpolate)
at Abt.Controls.SciChart.Visuals.RenderableSeries.BaseColumnRenderableSeries.HitTest(Point rawPoint, Double hitTestRadius, Boolean interpolate)
at Abt.Controls.SciChart.Visuals.RenderableSeries.BaseRenderableSeries.HitTest(Point rawPoint, Boolean interpolate)
at Abt.Controls.SciChart.ChartModifiers.InspectSeriesModifierBase. . (IRenderableSeries )
at Abt.Controls.SciChart.ChartModifiers.InspectSeriesModifierBase. .MoveNext()
at Abt.Controls.SciChart.ChartModifiers.TooltipModifier.YB(Point C, Point& D)
at Abt.Controls.SciChart.ChartModifiers.TooltipModifier.HandleMasterMouseEvent(Point mousePoint)
at Abt.Controls.SciChart.ChartModifiers.InspectSeriesModifierBase.YB(Point C)
at Abt.Controls.SciChart.ChartModifiers.InspectSeriesModifierBase.HandleMouseEvent(ModifierMouseArgs e)
at Abt.Controls.SciChart.ChartModifiers.InspectSeriesModifierBase.OnModifierMouseMove(ModifierMouseArgs e)
at Abt.Controls.SciChart.ChartModifiers.ModifierGroup.AC(IChartModifier C, ModifierEventArgsBase D)
at Abt.Controls.SciChart.ChartModifiers.ModifierGroup.YB(Action2 C, ModifierEventArgsBase D)1 , Action`1 )
at Abt.Controls.SciChart.ChartModifiers.ModifierGroup.OnModifierMouseMove(ModifierMouseArgs e)
at Abt.Controls.SciChart.Utility.Mouse.MouseManager. (ModifierMouseArgs , IReceiveMouseEvents , Boolean )
at Abt.Controls.SciChart.Utility.Mouse.MouseManager.
. . (IReceiveMouseEvents )
at Abt.Controls.SciChart.Common.Extensions.EnumerableExtensions. [ ](IEnumerable
at Abt.Controls.SciChart.Utility.Mouse.MouseManager.
. (Object , MouseEventArgs )
at A. . (MouseEventArgs )
at A. . (Object , MouseEventArgs )
at System.Windows.Input.MouseEventArgs.InvokeEventHandler(Delegate genericHandler, Object genericTarget)
at System.Windows.RoutedEventArgs.InvokeHandler(Delegate handler, Object target)
at System.Windows.RoutedEventHandlerInfo.InvokeHandler(Object target, RoutedEventArgs routedEventArgs)
at System.Windows.EventRoute.InvokeHandlersImpl(Object source, RoutedEventArgs args, Boolean reRaised)
at System.Windows.UIElement.RaiseEventImpl(DependencyObject sender, RoutedEventArgs args)
at System.Windows.UIElement.RaiseTrustedEvent(RoutedEventArgs args)
at System.Windows.UIElement.RaiseEvent(RoutedEventArgs args, Boolean trusted)
at System.Windows.Input.InputManager.ProcessStagingArea()
at System.Windows.Input.InputManager.ProcessInput(InputEventArgs input)
at System.Windows.Input.InputProviderSite.ReportInput(InputReport inputReport)
at System.Windows.Interop.HwndMouseInputProvider.ReportInput(IntPtr hwnd, InputMode mode, Int32 timestamp, RawMouseActions actions, Int32 x, Int32 y, Int32 wheel)
at System.Windows.Interop.HwndMouseInputProvider.FilterMessage(IntPtr hwnd, WindowMessage msg, IntPtr wParam, IntPtr lParam, Boolean& handled)
at System.Windows.Interop.HwndSource.InputFilterMessage(IntPtr hwnd, Int32 msg, IntPtr wParam, IntPtr lParam, Boolean& handled)
at MS.Win32.HwndWrapper.WndProc(IntPtr hwnd, Int32 msg, IntPtr wParam, IntPtr lParam, Boolean& handled)
at MS.Win32.HwndSubclass.DispatcherCallbackOperation(Object o)
at System.Windows.Threading.ExceptionWrapper.InternalRealCall(Delegate callback, Object args, Int32 numArgs)
at MS.Internal.Threading.ExceptionFilterHelper.TryCatchWhen(Object source, Delegate method, Object args, Int32 numArgs, Delegate catchHandler)
at System.Windows.Threading.Dispatcher.LegacyInvokeImpl(DispatcherPriority priority, TimeSpan timeout, Delegate method, Object args, Int32 numArgs)
at MS.Win32.HwndSubclass.SubclassWndProc(IntPtr hwnd, Int32 msg, IntPtr wParam, IntPtr lParam)
at MS.Win32.UnsafeNativeMethods.DispatchMessage(MSG& msg)
at System.Windows.Threading.Dispatcher.PushFrameImpl(DispatcherFrame frame)
at System.Windows.Threading.Dispatcher.PushFrame(DispatcherFrame frame)
at System.Windows.Threading.Dispatcher.Run()
at System.Windows.Application.RunDispatcher(Object ignore)
at System.Windows.Application.RunInternal(Window window)
at System.Windows.Application.Run(Window window)
at System.Windows.Application.Run()
at ISF.Application.App.Main() in c:\Users\Charbel\Documents\Projects\ISF\ISFSolution\ISF.Application\obj\Debug\App.g.cs:line 0
at System.AppDomain._nExecuteAssembly(RuntimeAssembly assembly, String[] args)
at System.AppDomain.nExecuteAssembly(RuntimeAssembly assembly, String[] args)
at System.Runtime.Hosting.ManifestRunner.Run(Boolean checkAptModel)
at System.Runtime.Hosting.ManifestRunner.ExecuteAsAssembly()
at System.Runtime.Hosting.ApplicationActivator.CreateInstance(ActivationContext activationContext, String[] activationCustomData)
at System.Runtime.Hosting.ApplicationActivator.CreateInstance(ActivationContext activationContext)
at System.Activator.CreateInstance(ActivationContext activationContext)
at Microsoft.VisualStudio.HostingProcess.HostProc.RunUsersAssemblyDebugInZone()
at System.Threading.ThreadHelper.ThreadStart_Context(Object state)
at System.Threading.ExecutionContext.RunInternal(ExecutionContext executionContext, ContextCallback callback, Object state, Boolean preserveSyncCtx)
at System.Threading.ExecutionContext.Run(ExecutionContext executionContext, ContextCallback callback, Object state, Boolean preserveSyncCtx)
at System.Threading.ExecutionContext.Run(ExecutionContext executionContext, ContextCallback callback, Object state)
at System.Threading.ThreadHelper.ThreadStart()
If zoom extends is called, I get the following stack trace:
at Abt.Controls.SciChart.Visuals.RenderableSeries.StackedColumnRenderableSeries.GetXRange()
at Abt.Controls.SciChart.Visuals.Axes.AxisBase.YB()
at Abt.Controls.SciChart.Visuals.Axes.AxisBase.GetMaximumRange()
at Abt.Controls.SciChart.Visuals.SciChartSurface.YB(TimeSpan C)
at Abt.Controls.SciChart.Visuals.SciChartSurface.YB(TimeSpan C)
at Abt.Controls.SciChart.Visuals.SciChartSurface.ZoomExtents()
at ISF.Application.Dashboard.Windows.Dashboard.ZoomExtents(SciChartSurface chart) in c:\Users\Charbel\Documents\Projects\ISF\ISFSolution\ISF.Application\Dashboard\Windows\Dashboard.xaml.cs:line 54
More info in case it helps:
I tried using the SimpleRolloverModifier code from http://support.scichart.com/index.php?/Knowledgebase/Article/View/17235/32/custom-chartmodifiers—part-1—creating-a-custom-rollover-modifier
And found that when the problem happens, the hit test either detects nothing or causes a null reference.
The problem ONLY happens when I open and close the modal window. If I don’t do that all works fine.
Thanks
Charbel
- cabdo asked 9 years ago
- last active 9 years ago
Hi,
NOTE: Still using Scichart 1.7 here…
I have two questions about the rollovermodifier behaviour:
-
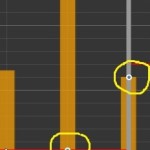
As you can see in the picture, when rolling over the chart, sometimes the Xvalues of the series are not aligned. Is it possible to force this to be the same? Basically i always want the Xvalue to be the same for all the series when rolling over, would be nice to have the xvalue where the vertical bar is shown…
-
Might be just the chart behaviour, but is it possible to have the rollover feedback performed for values not in the visible range? When zoomed in, and for instance the top of the columnBar is not within the range, the seriesinfo is not shown for this datapoint.
Thanks a lot for the feedback.
- Robert Post asked 9 years ago
- last active 9 years ago
A question was recently asked on priority support tickets – how to to apply a Template Selector to the RolloverModifier, to display different tooltips based on series type?
We are answering the question below so that other users can benefit from it!
- Andrew Burnett-Thompson asked 9 years ago
- last active 9 years ago
Hi All,
Although this issue isn’t currently stopping me doing what I need to do I’m just a tad worried that I’m doing something more fundamental wrong which probably will. Anyway the question…
I have a chart with a DateTime axis to which I add two series (red and blue points) from the code behind as per the code snippet. When I run it both series are displayed correctly but the rollover bar only snaps to the second series points. If a run the mouse over a point from the first series it seems to be acknowledged as the fill colour changes but the rollover doesn’t snap to it.
The method is invoked by a button press on a parent control
public void AddTestDataSeries(double seedvalue)
{
    DateTime StartPoint = DateTime.Now;
    DateTime[] Axis = new DateTime[] { StartPoint.AddMinutes(1), StartPoint.AddMinutes(2), StartPoint.AddMinutes(3), StartPoint.AddMinutes(4), StartPoint.AddMinutes(5), StartPoint.AddMinutes(6), StartPoint.AddMinutes(7), StartPoint.AddMinutes(8) };
    double[] Series1 = new double[]{1,2,3,5,7,12,19,37};
    double[] Series2 = new double[]{10,20,30,40,50,60,70,80};

    XyDataSeries<DateTime, double> dataSeries1 = new XyDataSeries<DateTime, double> { SeriesName = "Series1" };
    for (int x = 0; x < Series1.Count(); x++)
    {
        dataSeries1.Append(Axis[x], Series1[x]);
    }
    XyScatterRenderableSeries scatterRenderSeries1 = new XyScatterRenderableSeries();
    scatterRenderSeries1.DataSeries = dataSeries1;
    scatterRenderSeries1.PointMarker = new EllipsePointMarker()
    {
        Fill = Colors.Red,
        Stroke = Colors.White,
        StrokeThickness = 2,
        Width = 10,
        Height = 10,
    };
    this.UserControlSciChartSurface.RenderableSeries.Add(scatterRenderSeries1);

    XyDataSeries<DateTime, double> dataSeries2 = new XyDataSeries<DateTime, double> { SeriesName = "Series2" };
    for (int x = 0; x < Series2.Count(); x++)
    {
        dataSeries2.Append(Axis[x].AddSeconds(30), Series2[x]);
    }
    XyScatterRenderableSeries scatterRenderSeries2 = new XyScatterRenderableSeries();
    scatterRenderSeries2.DataSeries = dataSeries2;
    scatterRenderSeries2.PointMarker = new EllipsePointMarker()
    {
        Fill = Colors.Blue,
        Stroke = Colors.White,
        StrokeThickness = 2,
        Width = 10,
        Height = 10,
    };
    this.UserControlSciChartSurface.RenderableSeries.Add(scatterRenderSeries2);

}
And the XAML is simply
<UserControl
         x:Class="SummaryDrillDownCharting.SummaryDataChartUserControl"
         xmlns="http://schemas.microsoft.com/winfx/2006/xaml/presentation"
         xmlns:x="http://schemas.microsoft.com/winfx/2006/xaml"
         xmlns:mc="http://schemas.openxmlformats.org/markup-compatibility/2006"
         xmlns:d="http://schemas.microsoft.com/expression/blend/2008"
         xmlns:s="http://schemas.abtsoftware.co.uk/scichart"
         mc:Ignorable="d"
         d:DesignHeight="300" d:DesignWidth="300">

<Grid>
    <s:SciChartSurface x:Name="UserControlSciChartSurface" s:ThemeManager.Theme="Chrome">

        <s:SciChartSurface.XAxis>
            <s:DateTimeAxis GrowBy="0.1, 0.1"/>
        </s:SciChartSurface.XAxis>

        <s:SciChartSurface.YAxis>
            <s:NumericAxis GrowBy="0.1, 0.1" DrawMajorBands="True"/>
        </s:SciChartSurface.YAxis>

        <s:SciChartSurface.ChartModifier>
            <s:ModifierGroup>
                <s:RolloverModifier IsEnabled="True"></s:RolloverModifier>
            </s:ModifierGroup>
        </s:SciChartSurface.ChartModifier>

    </s:SciChartSurface>
</Grid>
ADDITIONAL INFO: I Just ran the same code changing the scatter to a FastLineRenderableSeries – same problem exists.
- Stuart McCullough asked 9 years ago
- last active 9 years ago
Hello,
Is there an event that is triggered by the rollover modifier, or some other modifier for that matter?
Basically, I am trying to get the X/Y values of the point that the mouse is currently over through code.
Any help is appreciated.
- Aaron Douglas asked 9 years ago
- last active 9 years ago
Hello,
I am currently using a rollover modifier to display tooltip values on the trend. Whenever a data point is clicked however, the trend stretches so this point is along the right hand axis, and it pans so this point is along the x-axis. Is there a way to disable this feature?
Here are my modifier declarations:
<SciChart:SciChartSurface.ChartModifier>
            <SciChart:ModifierGroup>
                <SciChart:RubberBandXyZoomModifier  IsXAxisOnly="False"/>
                <SciChart:XAxisDragModifier/>
                <SciChart:CursorModifier ShowAxisLabels="False"/>
                <SciChart:RolloverModifier ReceiveHandledEvents="False" ShowTooltipOn="Always" ShowAxisLabels="True" UseInterpolation="True" SnapsToDevicePixels="False" TooltipLabelTemplate="{StaticResource RolloverLabelTemplate}"/>
            </SciChart:ModifierGroup>
        </SciChart:SciChartSurface.ChartModifier>
Thanks,
Andrew
- Andrew Moghadam asked 9 years ago
- last active 9 years ago
I only want to move the RolloverModifier if the left mouse button is pressed and with Left and Right Keys?
- Daniel Hartl asked 9 years ago
- last active 9 years ago
Hi,
I’m using the rollover modifer on some charts. I’m using an XYDataSeries<int, int>. However, the tooltip is displaying the Y values as decimal with 3 floating precision (screenshot attached), while what I want is a simple integer to show. Here’s the chart code in xaml:
<s:SciChartSurface FlowDirection="LeftToRight" s:ThemeManager.Theme="Chrome" SeriesSource="{Binding Series}" ChartTitle="{Binding Title}" HorizontalAlignment="Stretch" VerticalAlignment="Stretch" Name="chrtSurface" MouseDoubleClick="ChrtSurface_OnMouseDoubleClick" Tag="{Binding}">
                                <s:SciChartSurface.XAxis>
                                    <s:NumericAxis LabelProvider="{Binding LabelProvider}" AutoTicks="False" MajorDelta="1" MinorDelta="1" DrawMinorGridLines="False">
                                    </s:NumericAxis>
                                </s:SciChartSurface.XAxis>

                                <s:SciChartSurface.YAxis>
                                    <s:NumericAxis GrowBy="0,1" AxisTitle ="{Binding YAxisLabel}">
                                    </s:NumericAxis>
                                </s:SciChartSurface.YAxis>

                                <s:SciChartSurface.ChartModifier>
                                    <s:ModifierGroup>
                                        <s:LegendModifier GetLegendDataFor="AllSeries" ShowLegend="{Binding IsMultiChart}" ShowVisibilityCheckboxes="False">
                                            <s:SciChartLegend Margin="23,23" Orientation="Horizontal" LegendData="{Binding SeriesInfos}" >
                                            </s:SciChartLegend>
                                        </s:LegendModifier>
                                        <s:RubberBandXyZoomModifier IsXAxisOnly="True" />
                                        <s:ZoomExtentsModifier ExecuteOn="MouseRightButton"/>
                                        <s:RolloverModifier ShowAxisLabels="{Binding IsNotEmptyChart}"></s:RolloverModifier>
                                        <s:MouseWheelZoomModifier></s:MouseWheelZoomModifier>
                                    </s:ModifierGroup>
                                </s:SciChartSurface.ChartModifier>
                            </s:SciChartSurface>
- cabdo asked 9 years ago
- last active 9 years ago
How to do that? Let’s use the SciTrader as the example. We have CandlestickRenderableSeries, Ma500, Ma200 series on the chart. In rollover mode, I only want the CandlestickRenderableSeries show its tooltip. Please help.
Many thanks!
regards
Chunxi
- chunxi asked 9 years ago
- last active 9 years ago
Hi
I’m having trouble making the RolloverModifier TooltipLabels stay inside the graphs canvas.

As you can see on the left most graph the colored sqaures and some of the digits has fallen outside the graphs canvas.
Also what are the TooltipLabels rules for clustering together, and rules for which side of the RolloverMarker the labels should appear on?
Still having a problem here… After setting the ClipModifierSurface on the SciChartSurface to False the time axis no longer clips the TooltipLabels.
But the graph itself clips the TooltipLabels when the label gets to large.
How do I make the labels stay inside the graph? As there is a lot of free space to the right of the labels.

- Sander Struijk asked 10 years ago
- last active 10 years ago
