SciChart for Avalonia XPF v2.0 Released!
SciChart is thrilled to announce the release of SciChart for Avalonia XPF 2.0 – a major update that brings all features and improvements […]

We are pleased to announce that the long-awaited release of SciChart.js v.4 is approaching. You can try out BETA version right now. This is a huge release with many new features, but before we get to that, some important things to note:
1. This is a BETA update, so there may be bugs. Please report them at support.scichart.com and SciChart.js forum, making clear which version you are using.
2. Documentation and examples are not yet complete. We will be updating the documentation and the examples to explain and show off all the new features in the coming weeks. Once we have the key features reasonably covered, then we will remove the BETA tag and publish the new v4 demo with all the new examples.
3. This is a major release that has breaking changes, though these are mostly small and easy to update. We have a detailed list, including how to update at Breaking Changes in v4.
Polar Chart Example
This release is all about adding more in-demand charting possibilities, the biggest of which is polar charts. Our polar charts support line, column, mountain, band, scatter and heatmap series. No other charting library lets you adjust polar charts with rotating and tilting layouts. Whenever you specify the rotation and total angle and inner radius, SciChart will automatically size and position the chart.
You can find the full list of polar chart features, including chart types, annotations and interactive elements in the table below.
| Polar Chart Types & Series | Annotation Updates | Interactive Elements and other |
| Polar chart | Polar pointer annotation | Polar hit-test API |
| Partial polar chart | Polar native text annotation | Polar arc-zoom modifier |
| Polar line chart | Polar text SVG annotation | Polar cursor modifier |
| Polar band chart | Polar arc annotation | Polar data-point selection modifier |
| Polar column chart (area chart) | Polar custom SVG annotation | Polar mouse wheel zoom modifier |
| Polar heatmap | Polar line annotation | Polar pan modifier |
| Polar mountain chart | Polar zoom extents modifier | |
| Polar pie chart | Polar legend modifier | |
| Polar scatter chart | Sub-chart support for both cartesian and polar | |
| Polar stacked column chart | Polar data-labels support | |
| Polar stacked mountain chart | Custom texture background support | |
| Polar gauge chart |
Discover some of the latest polar chart possibilities in the image gallery.
 Polar Stacked Mountain Chart
 Polar Gauge Chart
 Polar Heatmap
 Polar Scatter Chart
 Radar Chart
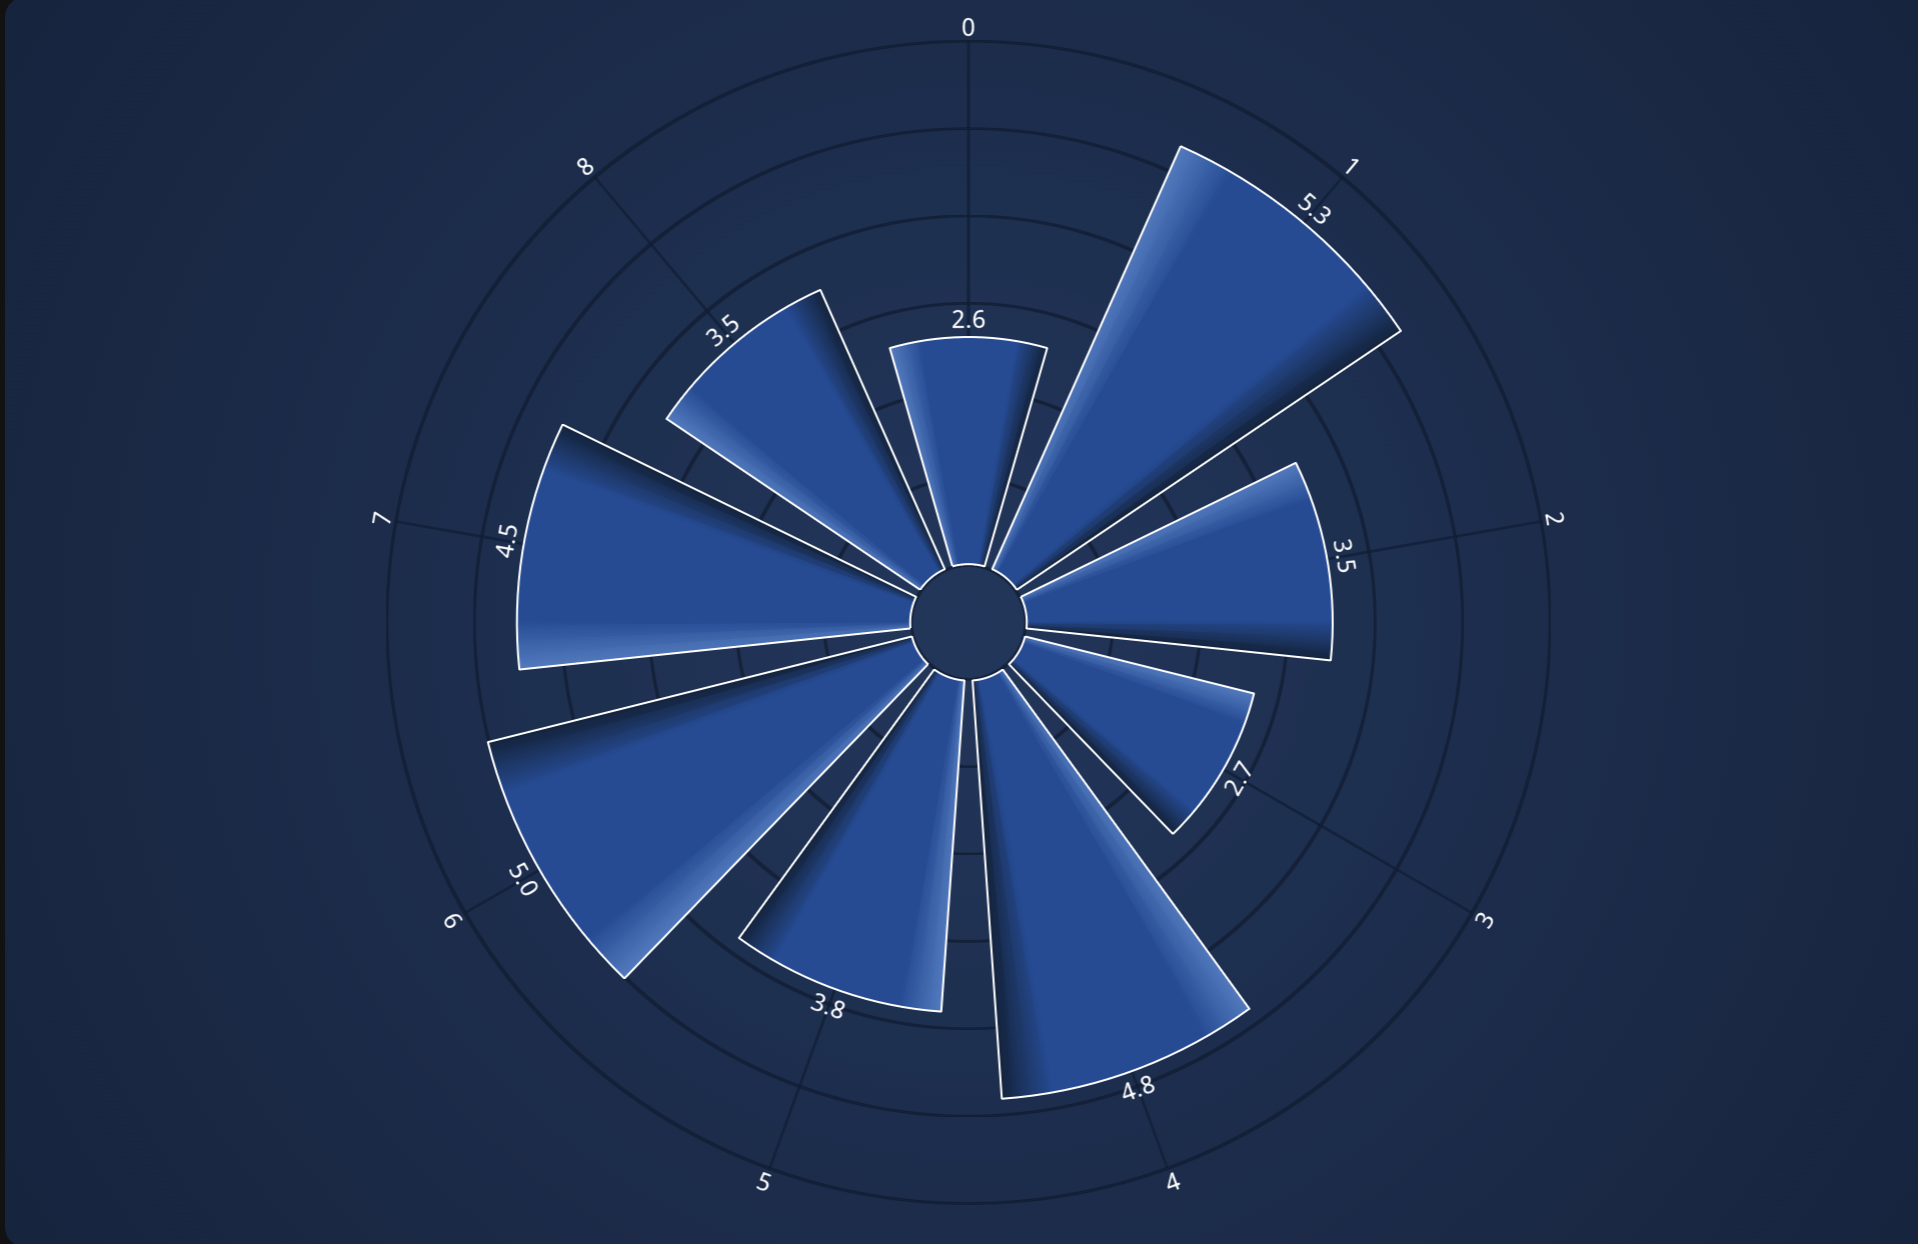 Polar Area Chart
We also introduced new cartesian chart types such as rectangle, box plot, line-segment, triangle and polygon charts and implemented some useful features like texture fills. These new series types can take various data formats, so we have refactored the DataSeries to be able to have any number of arrays, e.g., Xyx, Xyxy, a 5-value format specifically for box plots, XyN for sharing x values between multiple series, and the ability to easily define whatever format you need. The new HTMLTextAnnotation and HTMLCustomAnnotation allow you to add more responsive content to the chart.
You can find the full list of cartesian chart updates in the table below.
| Cartesian Chart Types & Series | Annotation Updates | Styling |
| Triangle series | HTML text annotation | Custom texture background support |
| Rectangle series (treemap chart) | Custom HTML annotation | Gradient fill support for stacked column series |
| Box plot series | Arc annotation | |
| Line segment series (vector field plot) |
 Box Plot Chart
 Triangle Series
 Treemap Chart
 Vector Field Plot
There are new annotations, including arc segments, arrows and polar pointers, allowing you to create a huge variety of gauge charts. New polar chart modifiers provide the ability to rotate, zoom and pan in both cartesian and polar space to give you whatever view you want. Polar subcharts allow you to combine polar and cartesian charts on the same surface.
Axis and series inclusion are now standardized across modifiers, along with a new, more flexible way of specifying execute conditions for modifiers. Annotations now have their own clipping property, which applies to both native and SVG annotations, allowing for more annotation types to be used over the axes. Ordered rendering allows you to easily change the z-order of series and annotations, even allowing you to interleave series and annotations and define relative ordering.
We will continue to support version 3 with critical fixes for at least 6 months after v4 is fully released, but we encourage all users to update as soon as possible, as further features and fixes will only happen on v4.
When Will the v4 Release Be Fully Available?
We are currently creating documentation and examples and polishing the API. We hope that process will take 4–6 weeks. After that, we will publish the v4 release.
The screenshots throughout this article are all from our v4 examples app, which you can get and run from the release v4.0 branch of SciChart.JS.Examples on GitHub. This will be updated with demos over the next few months and will replace the live demo once v4 is fully released.
Related Posts
![]()
Queens Award for Innovation
Proud winners of the Queens Award for Innovation, 2019. Awarded on account of our innovative graphics engine which underpins the SciChart library and enables our world-beating charting performance
![]()
National Business Awards
Highly Commended for Lloyds National Business Awards, 2019. Awarded on account of our innovative graphics engine and impressive customer base
![]()
National Technology Awards
Awarded “Healthcare Tech of the Year” at the 2025 National Technology Awards – a top UK recognition for breakthrough innovation in technology.

Reviews
SciChart has received hundreds of verified, 3rd party reviews