SciChart® the market leader in Fast WPF Charts, WPF 3D Charts, iOS Chart, Android Chart and JavaScript Chart Components
Please note! These examples are new to SciChart Mobile v3 release! SciChart iOS & Android ship with Xamarin.iOS and Xamarin.Android bindings around our native iOS & Android Chart controls, allowing you to create fast & feature rich charts to your Xamarin applications. We include ~90 native iOS examples and 90 Android examples, but now also ~60 Xamarin Chart Examples to help you get started with SciChart. You can download the source for our Xamarin Chart Examples from Github, or browse the source code below.
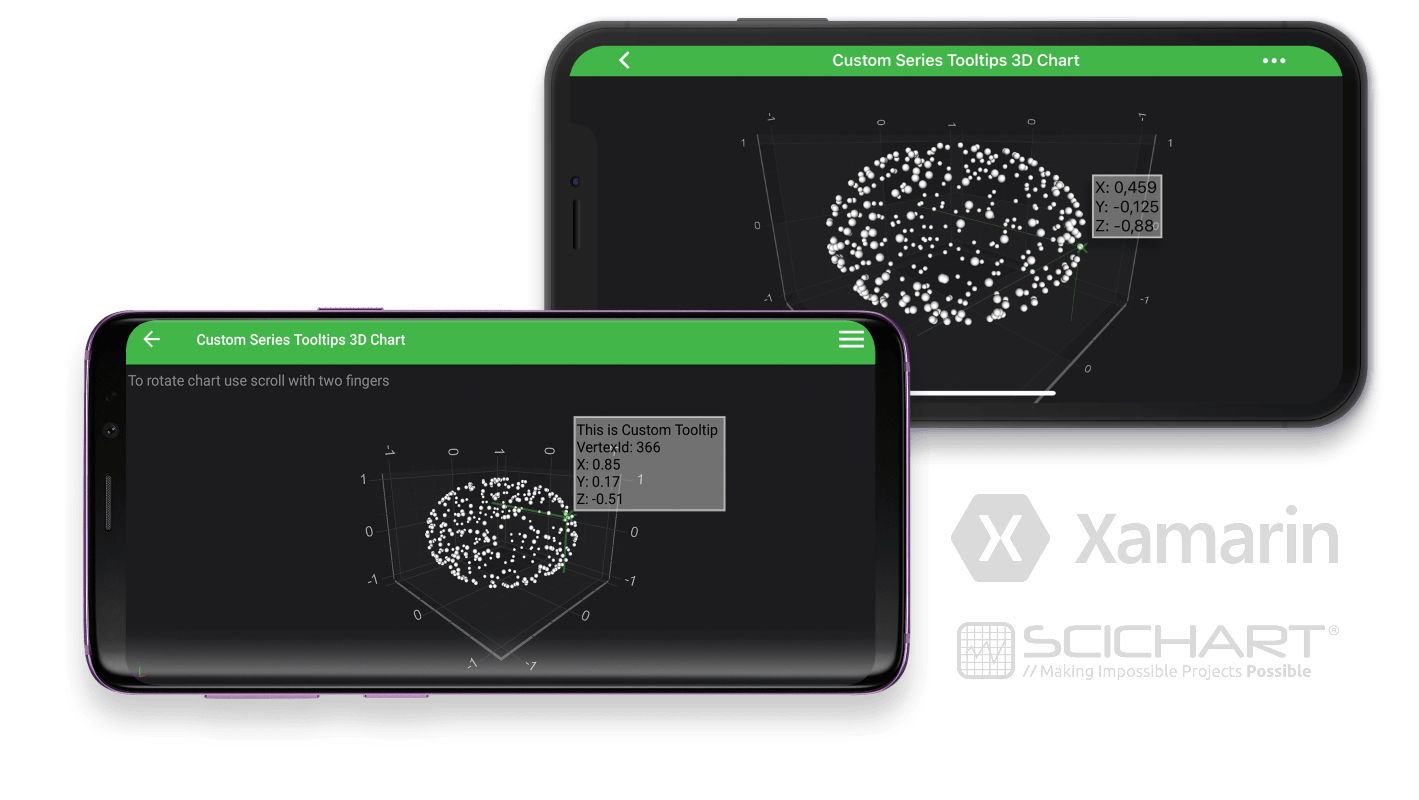
This example demonstrates how to customize look and feel of tooltip to the series in 3D with Xamarin. Tooltips, crosshairs and labels are very important as they make the charts and data easy to read.
Learn more from the documentation about Cursors and Tooltips: Cursor and tooltips in Xamarin.Android Cursor and tooltips in Xamarin.iOS
The C#/Xamarin.iOS/Xamarin.Android source code for the Xamarin Custom Series Tooltips 3D example is included below (Scroll down!).
Did you know you can also view the source code from one of the following sources as well?
using System;
using System.Text;
using ObjCRuntime;
using SciChart.iOS.Charting;
namespace Xamarin.Examples.Demo.iOS
{
[Example3DDefinition("Custom Series Tooltips 3D Chart", description: "Customize Tooltips on a 3D Chart", icon: ExampleIcon.LineChart)]
class SeriesCustomTooltips3DChartViewController : SingleChartWithModifierTipViewController<SCIChartSurface3D>
{
public override string ModifierTip => "To rotate chart use scroll with two fingers";
protected override void InitExample()
{
var random = new Random();
var dataSeries3D = new XyzDataSeries3D<double, double, double>();
for (int i = 0; i < 500; i++)
{
var m1 = random.Next(2) == 0 ? -1 : 1;
var m2 = random.Next(2) == 0 ? -1 : 1;
var x1 = random.NextDouble() * m1;
var x2 = random.NextDouble() * m2;
var temp = 1 - x1 * x1 - x2 * x2;
var x = 2 * x1 * Math.Sqrt(temp);
var y = 2 * x2 * Math.Sqrt(temp);
var z = 1 - 2 * (x1 * x1 + x2 * x2);
dataSeries3D.Append(x, y, z);
}
var rSeries3D = new SCIScatterRenderableSeries3D
{
DataSeries = dataSeries3D,
PointMarker = new SCISpherePointMarker3D { FillColor = 0x88FFFFFF, Size = 7f },
};
rSeries3D.SeriesInfoProvider = new CustomXyzSeriesInfo3DProvider();
using (Surface.SuspendUpdates())
{
Surface.XAxis = new SCINumericAxis3D { GrowBy = new SCIDoubleRange(0.2, 0.2), VisibleRange = new SCIDoubleRange(-1.1, 1.1) };
Surface.YAxis = new SCINumericAxis3D { GrowBy = new SCIDoubleRange(0.2, 0.2), VisibleRange = new SCIDoubleRange(-1.1, 1.1) };
Surface.ZAxis = new SCINumericAxis3D { GrowBy = new SCIDoubleRange(0.2, 0.2), VisibleRange = new SCIDoubleRange(-1.1, 1.1) };
Surface.RenderableSeries.Add(rSeries3D);
Surface.ChartModifiers = new SCIChartModifier3DCollection
{
new SCIPinchZoomModifier3D(),
new SCIOrbitModifier3D(defaultNumberOfTouches: 2) { ReceiveHandledEvents = true },
new SCIZoomExtentsModifier3D(),
new SCITooltipModifier3D
{
CrosshairMode = SCICrosshairMode.Lines,
CrosshairPlanesFill = 0x33FF6600.ToUIColor(),
ReceiveHandledEvents = true,
ExecuteOnPointerCount = 1
}
};
Surface.Camera = new SCICamera3D();
}
}
}
class CustomXyzSeriesInfo3DProvider : SCIDefaultXyzSeriesInfo3DProvider
{
protected override IISCISeriesTooltip3D GetSeriesTooltipInternal(SCISeriesInfo3D seriesInfo, Class modifierType)
{
if (modifierType.Name == typeof(SCITooltipModifier3D).ToClass().Name)
{
return new CustomXyzSeriesTooltip3D((SCIXyzSeriesInfo3D)seriesInfo);
}
return base.GetSeriesTooltipInternal(seriesInfo, modifierType);
}
}
class CustomXyzSeriesTooltip3D : SCIXyzSeriesTooltip3D
{
public CustomXyzSeriesTooltip3D(SCIXyzSeriesInfo3D seriesInfo) : base(seriesInfo) { }
protected override void InternalUpdate(SCISeriesInfo3D seriesInfo)
{
var xyzSeriesInfo = (SCIXyzSeriesInfo3D)seriesInfo;
var tooltipText = new StringBuilder();
tooltipText.Append("This is Custom Tooltip").Append(Environment.NewLine);
tooltipText.Append($"VertexId: {xyzSeriesInfo.VertexId}").Append(Environment.NewLine);
tooltipText.Append($"X: {seriesInfo.FormattedXValue}").Append(Environment.NewLine);
tooltipText.Append($"Y: {seriesInfo.FormattedYValue}").Append(Environment.NewLine);
tooltipText.Append($"Z: {seriesInfo.FormattedZValue}");
Text = tooltipText.ToString();
SetSeriesColor(xyzSeriesInfo.SeriesColor.ColorARGBCode());
}
}
}
using Android.Content;
using SciChart.Charting3D.Model;
using SciChart.Charting3D.Model.DataSeries.Xyz;
using SciChart.Charting3D.Modifiers;
using SciChart.Charting3D.Visuals;
using SciChart.Charting3D.Visuals.Axes;
using SciChart.Charting3D.Visuals.Camera;
using SciChart.Charting3D.Visuals.PointMarkers;
using SciChart.Charting3D.Visuals.RenderableSeries.HitTest;
using SciChart.Charting3D.Visuals.RenderableSeries.Scatter;
using SciChart.Charting3D.Visuals.RenderableSeries.Tooltips;
using SciChart.Data.Model;
using Xamarin.Examples.Demo.Data;
using Xamarin.Examples.Demo;
using System;
using System.Drawing;
using System.Text;
using Xamarin.Examples.Demo.Droid.Fragments.Base;
namespace Xamarin.Examples.Demo.Droid.Fragments.Examples3D
{
[Example3DDefinition("Series Custom Tooltips 3D Chart", description: "Customize Tooltips on a 3D Chart", icon: ExampleIcon.LineChart)]
class SeriesCustomTooltips3DChartFragment : ExampleBaseFragment
{
public SciChartSurface3D Surface => View.FindViewById<SciChartSurface3D>(Resource.Id.chart3d);
public override int ExampleLayoutId => Resource.Layout.Example_Single_3D_Chart_With_Modifier_Tip_Fragment;
protected override void InitExample()
{
var dataManager = DataManager.Instance;
var random = new Random();
var dataSeries3D = new XyzDataSeries3D<double, double, double>();
for (int i = 0; i < 500; i++)
{
var m1 = random.Next(2) == 0 ? -1 : 1;
var m2 = random.Next(2) == 0 ? -1 : 1;
var x1 = random.NextDouble() * m1;
var x2 = random.NextDouble() * m2;
var temp = 1 - x1 * x1 - x2 * x2;
var x = 2 * x1 * Math.Sqrt(temp);
var y = 2 * x2 * Math.Sqrt(temp);
var z = 1 - 2 * (x1 * x1 + x2 * x2);
dataSeries3D.Append(x, y, z);
}
var pointMarker3D = new SpherePointMarker3D()
{
FillColor = Color.FromArgb(0x88, 0xFF, 0xFF, 0xFF),
Size = 7f
};
var renderableSeries3D = new ScatterRenderableSeries3D()
{
PointMarker = pointMarker3D,
DataSeries = dataSeries3D,
SeriesInfoProvider = new CustomXyzSeriesInfo3DProvider()
};
using (Surface.SuspendUpdates())
{
Surface.XAxis = new NumericAxis3D() { GrowBy = new DoubleRange(0.2, 0.2), VisibleRange = new DoubleRange(-1.1, 1.1) };
Surface.YAxis = new NumericAxis3D() { GrowBy = new DoubleRange(0.2, 0.2), VisibleRange = new DoubleRange(-1.1, 1.1) };
Surface.ZAxis = new NumericAxis3D() { GrowBy = new DoubleRange(0.2, 0.2), VisibleRange = new DoubleRange(-1.1, 1.1) };
Surface.Camera = new Camera3D();
Surface.RenderableSeries.Add(renderableSeries3D);
Surface.ChartModifiers = new ChartModifier3DCollection
{
new PinchZoomModifier3D(),
new OrbitModifier3D() { ReceiveHandledEvents = true, ExecuteOnPointerCount = 2 },
new ZoomExtentsModifier3D(),
new TooltipModifier3D()
{
CrosshairMode = CrosshairMode.Lines,
CrosshairPlanesFill = 0x33FF6600,
ReceiveHandledEvents = true,
ExecuteOnPointerCount = 1
}
};
}
}
}
class CustomXyzSeriesInfo3DProvider : DefaultXyzSeriesInfo3DProvider
{
private readonly Java.Lang.Class _tooltipModifier3DClass = Java.Lang.Class.FromType(typeof(TooltipModifier3D));
protected override ISeriesTooltip3D GetSeriesTooltipInternal(Context context, XyzSeriesInfo3D seriesInfo, Java.Lang.Class modifierType)
{
if (modifierType == _tooltipModifier3DClass)
{
return new CustomXyzSeriesTooltip3D(context, seriesInfo);
}
else
{
return base.GetSeriesTooltipInternal(context, seriesInfo, modifierType);
}
}
}
class CustomXyzSeriesTooltip3D : XyzSeriesTooltip3D
{
public CustomXyzSeriesTooltip3D(Context context, XyzSeriesInfo3D seriesInfo) : base(context, seriesInfo)
{
}
protected override void InternalUpdate(XyzSeriesInfo3D seriesInfo)
{
var tooltipText = new StringBuilder();
tooltipText.Append("This is Custom Tooltip").Append(Environment.NewLine);
tooltipText.Append($"VertexId: {seriesInfo.VertexId}").Append(Environment.NewLine);
tooltipText.Append($"X: {seriesInfo.FormattedXValue}").Append(Environment.NewLine);
tooltipText.Append($"Y: {seriesInfo.FormattedYValue}").Append(Environment.NewLine);
tooltipText.Append($"Z: {seriesInfo.FormattedZValue}");
Text = tooltipText.ToString();
SetSeriesColor(seriesInfo.SeriesColor);
}
}
}