SciChart® the market leader in Fast WPF Charts, WPF 3D Charts, iOS Chart, Android Chart and JavaScript Chart Components
Please note! These examples are new to SciChart Mobile v3 release! SciChart iOS & Android ship with Xamarin.iOS and Xamarin.Android bindings around our native iOS & Android Chart controls, allowing you to create fast & feature rich charts to your Xamarin applications. We include ~90 native iOS examples and 90 Android examples, but now also ~60 Xamarin Chart Examples to help you get started with SciChart. You can download the source for our Xamarin Chart Examples from Github, or browse the source code below.
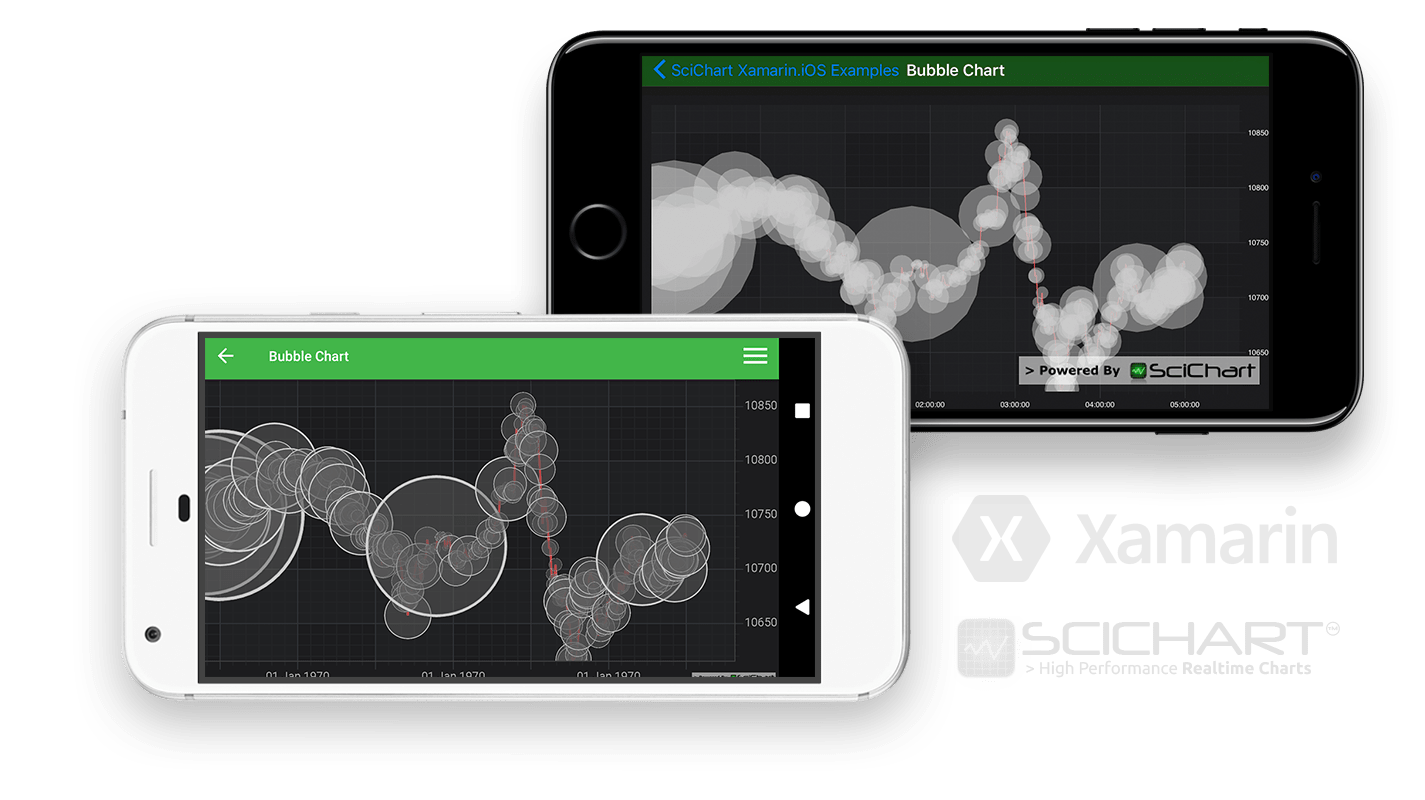
This example demonstrates how to create a simple Bubble Chart with Xamarin.iOS and Xamarin.Android for your mobile apps.
A Xamarin Bubble chart can be used to visualize multi-dimensional data on a 2D Chart, for example, using the Bubble size (Z property) and color can denote data of increasing importance or weight at an X-Y location. Bubble charts are widely used in applications for investments, sales, marketing and many more.
In iOS the SCIFastBubbleRenderableSeries requires a SCIXyzDataSeries, which contains one Z-value per X-Y point and in Android it is FastBubbleRenderableSeries, that requires an instance of XyzDataSeries, which contains X and Y points with position of the bubble and Z value which represents its radius.
Documentation Links
The C#/Xamarin.iOS/Xamarin.Android source code for the Xamarin Bubble Chart example is included below (Scroll down!).
Did you know you can also view the source code from one of the following sources as well?
using System;
using System.Linq;
using Xamarin.Examples.Demo.Data;
using SciChart.iOS.Charting;
namespace Xamarin.Examples.Demo.iOS
{
[ExampleDefinition("Bubble Chart", description: "Generates a Line and Bubble series chart in code", icon: ExampleIcon.BubbleChart)]
public class BubbleChartViewController : SingleChartViewController<SCIChartSurface>
{
protected override void InitExample()
{
var xAxis = new SCIDateAxis { GrowBy = new SCIDoubleRange(0.0, 0.1) };
var yAxis = new SCINumericAxis { GrowBy = new SCIDoubleRange(0, 0.1) };
var dataSeries = new XyzDataSeries<DateTime, double, double>();
var tradeDataSource = DataManager.Instance.GetTradeticks().ToArray();
dataSeries.Append(
tradeDataSource.Select(x => x.TradeDate).ToArray(),
tradeDataSource.Select(x => x.TradePrice).ToArray(),
tradeDataSource.Select(x => x.TradeSize).ToArray());
var lineSeries = new SCIFastLineRenderableSeries { DataSeries = dataSeries, StrokeStyle = new SCISolidPenStyle(0xFFFF3333, 1f) };
var rSeries = new SCIFastBubbleRenderableSeries
{
DataSeries = dataSeries,
ZScaleFactor = 1,
AutoZRange = false,
BubbleBrushStyle = new SCISolidBrushStyle(0x50CCCCCC),
StrokeStyle = new SCISolidPenStyle(0xFFCCCCCC, 2f)
};
using (Surface.SuspendUpdates())
{
Surface.XAxes.Add(xAxis);
Surface.YAxes.Add(yAxis);
Surface.RenderableSeries.Add(lineSeries);
Surface.RenderableSeries.Add(rSeries);
Surface.ChartModifiers.Add(new SCIZoomExtentsModifier());
SCIAnimations.ScaleSeriesWithZeroLine(rSeries, 10600, 3, new SCIElasticEase());
SCIAnimations.ScaleSeriesWithZeroLine(lineSeries, 10600, 3, new SCIElasticEase());
}
}
}
}
using System;
using System.Linq;
using Android.Views.Animations;
using SciChart.Charting.Model;
using SciChart.Charting.Model.DataSeries;
using SciChart.Charting.Modifiers;
using SciChart.Charting.Visuals;
using SciChart.Charting.Visuals.Animations;
using SciChart.Charting.Visuals.Axes;
using SciChart.Charting.Visuals.RenderableSeries;
using SciChart.Data.Model;
using SciChart.Drawing.Common;
using Xamarin.Examples.Demo.Data;
using Xamarin.Examples.Demo;
using Xamarin.Examples.Demo.Droid.Extensions;
using Xamarin.Examples.Demo.Droid.Fragments.Base;
namespace Xamarin.Examples.Demo.Droid.Fragments.Examples
{
[ExampleDefinition("Bubble Chart", description:"Creates a Bubble Series and Line Chart", icon: ExampleIcon.BubbleChart)]
public class BubbleChartFragment : ExampleBaseFragment
{
public SciChartSurface Surface => View.FindViewById<SciChartSurface>(Resource.Id.chart);
public override int ExampleLayoutId => Resource.Layout.Example_Single_Chart_Fragment;
protected override void InitExample()
{
var xAxis = new DateAxis(Activity) {GrowBy = new DoubleRange(0, 0.1)};
var yAxis = new NumericAxis(Activity) {GrowBy = new DoubleRange(0, 0.1)};
var dataSeries = new XyzDataSeries<DateTime, double, double>();
var tradeDataSource = DataManager.Instance.GetTradeticks().ToArray();
dataSeries.Append(
tradeDataSource.Select(x => x.TradeDate),
tradeDataSource.Select(x => x.TradePrice),
tradeDataSource.Select(x => x.TradeSize));
var lineSeries = new FastLineRenderableSeries
{
DataSeries = dataSeries,
StrokeStyle = new SolidPenStyle(0xFFFF3333, 1.ToDip(Activity))
};
var bubbleSeries = new FastBubbleRenderableSeries
{
DataSeries = dataSeries,
BubbleBrushStyle = new SolidBrushStyle(0x77CCCCCC),
StrokeStyle = new SolidPenStyle(0xFFCCCCCC, 2f.ToDip(Activity)),
ZScaleFactor = 3,
AutoZRange = false,
};
using (Surface.SuspendUpdates())
{
Surface.XAxes.Add(xAxis);
Surface.YAxes.Add(yAxis);
Surface.RenderableSeries.Add(lineSeries);
Surface.RenderableSeries.Add(bubbleSeries);
Surface.ChartModifiers = new ChartModifierCollection
{
new RubberBandXyZoomModifier(),
new ZoomExtentsModifier(),
};
new ScaleAnimatorBuilder(lineSeries, 10600d) { Interpolator = new OvershootInterpolator(), Duration = 1000, StartDelay = 600 }.Start();
new ScaleAnimatorBuilder(bubbleSeries, 10600d) { Interpolator = new OvershootInterpolator(), Duration = 1000, StartDelay = 600 }.Start();
}
}
}
}