I see there is a Polar chart type for WPF charts and that one is “coming soon” to Android. Is it known when we can expect it to be available on Android?
Thank you in advance.
- MIha Rozina asked 7 years ago
- last active 6 years ago
Hello.
When the “RotationAngle” is set for “PolarXAxis” in the range -180 to 0 degrees, the “HitTest” method returns a “HitTestInfo” instance with an invalid “DataSeriesIndex” value. In most cases, “DataSeriesIndex” differs by 1 from the position of the item in the “DataSeries” collection under the mouse cursor.
Please help me to solve this problem.
The attached project reproduces only this problem.
- Maksim Volkov asked 4 years ago
- last active 3 years ago
Hi SciChart team,
there is a working example that implement a Polar Chart type for iOS?
I was unable to find anything in the documentation. Only for WPF platform.
If not, there is a plan to support this kind of chart in next release of the library?
Thanks for the help.
- Samuele Scatena asked 4 years ago
- last active 4 years ago
I recently needed to change the Rotation Angle of a polar plot from the default to 90 degrees. We have line annotations for different points on the polar plot. After the change, the annotation was still plotted on the default Rotation Angle.
I manually updated the points like this for the annotations to work:
var line = new LineAnnotation();

                var x1 = (double)NewSeries.DataSeries.XValues[0];
                var x2 = (double)NewSeries.DataSeries.XValues[1];

                if (x1.Between(0, 90) && x2.Between(0, 90))
                {
                    x1 += 270;
                    x2 += 270;
                }
                else
                {
                    x1 -= 90;
                    x2 -= 90;
                }

                line.X1 = x1;
                line.X2 = x2;
Is there another way to update the annotation or is something like this the preferred way?
- Bart Terrell asked 5 years ago
- last active 4 years ago
Hi,
I attached two images of what I need to do (easier than explaining it), I’m interested in the blue polygon, It could resemble the use of columns with the polar chart, but not quite, is there a simple way to do this or could someone point me to the right direction?
Thank you
Alex
- Alessio Diana asked 7 years ago
- last active 7 years ago
I want to create a custom modifier for a polar chart.
But I failed immediately!
First I wanted to add a simple 10×10 px ellipse.
But the ellipse doesn’t appear on the chart!
public override void OnModifierMouseDown(ModifierMouseArgs e)
{
    var translatedPont = ParentSurface.RootGrid.TranslatePoint(e.MousePoint, ParentSurface.ModifierSurface);

    var point = new Ellipse
    {
        Width = 10,
        Height = 10,
        Stroke = Brushes.White,
        StrokeThickness = 1,
        Fill = Brushes.Gray
    };

    ParentSurface.ModifierSurface.Children.Add(point);

    point.MeasureArrange();

    var leftCoordinate = translatedPont.X - point.ActualWidth / 2;
    var topCoordinate = translatedPont.Y - point.ActualHeight / 2;

    Canvas.SetLeft(point, leftCoordinate);
    Canvas.SetTop(point, topCoordinate);
...
- Ivan Lepekhov asked 4 years ago
Hi,
I would like to know if the SCICHART support the 3D polar plot, as shown below.
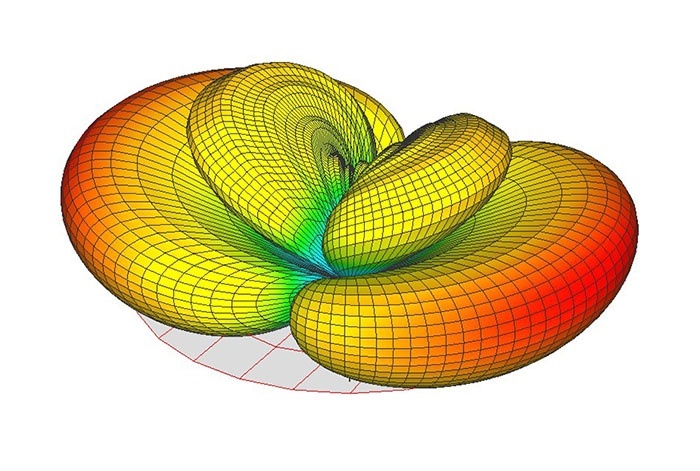
Many thanks
Dan
- Yinliang Diao asked 6 years ago
- last active 6 years ago
Hello,
I’m working with a polar chart and I’m having certain issues with the grid.
I’m trying to get a grid that covers all the surface, but I am not able to get it. I think it’s related to the Polar#Axis.
When I set a -200 margin on the Y axis, the grid lines separate and look like they are starting when I want, but they are not being draw outside the original circle.
When I set a -200 margin on the X axis, the outer circle goes outside the surface (red brush to watch it), but the Y axis does not reach the X axis and still inside the original circle.
Is there any way to get the desired grid?
I attach my code and a few images.
Thanks in advance.
                    <Grid Visibility="{Binding ShowPolarGrid, Converter={StaticResource BooleanToVisibilityConverter}}" >
                        <s:SciChartSurface Name="PolarGrid"
                               MaxFrameRate="24"
                                  BorderBrush="Lime" BorderThickness="2">
                            <s:SciChartSurface.XAxis>
                                <s:PolarXAxis DrawMajorGridLines="True"
                                  DrawMinorGridLines="{Binding PolarMinorLines}" MinorsPerMajor="2"
                                  DrawMajorTicks="False"
                                  DrawMinorTicks="False"
                                  AutoRange="Never"
                                  BorderBrush="Red"/>
                            </s:SciChartSurface.XAxis>

                            <s:SciChartSurface.YAxis>
                                <s:PolarYAxis DrawMajorGridLines="True"
                                  DrawMinorGridLines="{Binding PolarMinorLines}" MinorsPerMajor="2"
                                  DrawMajorTicks="False"
                                  DrawMinorTicks="False"
                                  VisibleRange="0, 1"
                                  AutoRange="Never"
                                  MajorDelta="1" />
                            </s:SciChartSurface.YAxis>
                        </s:SciChartSurface>
                    </Grid>
- S C asked 8 years ago
Hello,
I have a polar chart in my wpf application and I want to get data value from pixel coordinates, once the user has
clicked on scichart surface. This is what I tried:
   mouseClick = (s, arg) =>
        {
            var mousePoint = arg.GetPosition((UIElement)this.sciChartSurface.GridLinesPanel);

    //From cartesian to polar conversion
            double xpolar = Math.Atan(mousePoint2.Y / mousePoint2.X);
            double ypolar = Math.Sqrt(Math.Pow(mousePoint2.X, 2) + Math.Pow(mousePoint2.Y, 2));

            double a = sciChartSurface.RenderableSeries[_trace_index].XAxis.GetCurrentCoordinateCalculator().GetDataValue(xpolar);
            double b = sciChartSurface.RenderableSeries[_trace_index].YAxis.GetCurrentCoordinateCalculator().GetDataValue(ypolar);
};
This code gets mouse point coordinates, then it converts pixel coordinates to polar, and then (a,b) data are obtained with
GetCurrentCoordinateCalculator().GetDataValue(), but a and b have some strange values. I’ve tried just the opposite (from data value to pixel coordinate using GetCoordinate()), but it still doesn’t work. Any ideas? Is it possible to get data from pixel coordinates in polar chart?
Thanks in advance,
Juan
- Jose Mora Almerich asked 8 years ago
- last active 8 years ago
I’m trying out polar chart for my specific needs. In my scenario x-axis needs to display 0-360 (angle) values starting from bottom and going counter-clockwise so that 0 is at the bottom, 90 is at right, 180 is at the top and so on. Looking at polar chart default x-axis display it starts from right and go clockwise. Is there any way to change this behavior?
- Parashar Satpute asked 9 years ago
- last active 5 years ago
Hello all,
I am implementing polar chart in my wpf application, and I am trying to customize the next with no success:
– Xaxis data range is between the lowest and the highest value. I need that xaxis goes from 0º to 360º, but sometimes my angle dataseries does not cover the whole range (i.e. it goes from 15º to 270º). I’ve tried a customtickprovider, setting VisibleRange from 0 to 360º, but it doesn’t work. Any ideas?
– I need that the line connecting to points is a straight, but a curve is drawn instead. Is there any property in PolarXAxis or FastLineRenderableSeries to achieve this?
Regards,
Juan
- Jose Mora Almerich asked 8 years ago
- last active 8 years ago
Hello,
I am having an issue with the supplied DataPointSelectionModifier for the Polar Chart. The multiselect and drag function works properly.
However, I want to be able to also select a single point, or multiple singular points using the ctrl key + clicking on a point. This works for the X/Y chart, but not Polar. Could there be a setting I am missing?
Please let me know if this is enough information to go by, and the question is clear.
Thanks much,
-Timothy
- Timothy Eichfeld asked 7 years ago
Hi everyone,
i’m just looking for a polar chart that can plot 3D-Data like Heatmap Chart. Anyone has an idea about it?
- Yiheng TANG asked 9 years ago
- last active 9 years ago
Request for enhancement to polar charts to allow for rotation of the X axis. I want to use this chart type with compass directions. Therefore a range of 0-360 with 0 at the top of the chart.
I was able to use the workaround for rotation here:
https://www.scichart.com/questions/question/polar-chart-x-axis-starting-point-and-direction
However as the OP on that question noted there are several drawbacks to simply rotating the entire chart surface.
Also I found that at run-time rotating the chart surface is inaccurate as in this example:
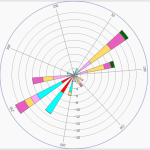
As you can see the 100 degree mark is not in the correct location. Directly right should be 90.
In the designer the chart axis looks as it should:
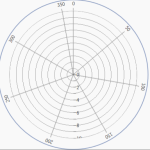
- wawr asked 9 years ago
- last active 5 years ago
Hi there!
I wonder if SciChart has support (for Android & iOS) for the following chart types (see attached example chart images):
-
Timeline chart (where events are mapped onto a linear timeline)
-
“Equation” chart (which shows an ellipsis, based on a mathematical equation)
-
Polar chart (as line, column and stacked bars)
If yes, how do I implement these chart types!?
Thanks in advance!
/Jacob
- Jacob Mattsson asked 2 years ago
- last active 2 years ago
Hello.
I want to get a polar chart with 360 degree on x-scale with a constant tick step. I found how to do it with MajorDelta. My code is:
        <s:SciChartSurface.XAxis>
            <s:PolarXAxis Name="xAxis"
                          AxisTitle="Polar Chart"
                          BorderBrush="#93A3C5"
                          RotationAngle="90"
                          AutoTicks="False"
                          MajorDelta="30"
                          MinorDelta="10"
                          BorderThickness="0,2,0,0"
                          TitleFontSize="20"
                          VisibleRange="0,360"/>
        </s:SciChartSurface.XAxis>
And I got a 30-degree step of major ticks. But tick labels were lost. It is only on 0 and 240. I get all labels when I add some data in series and call sciChart.ZoomExtents() as in basic example. But initially, I don’t have any data to show. Moreover, I’m using MVVM and I need to control VisibleRange of Y axis, so ZoomExtents is unlikely.
The second issue with the polar chart – how to control VisibleRange of Y-axis? My code is:
            <s:PolarYAxis Name="yAxis"
                          AutoRange="Never"
                          VisibleRange="{Binding YVisibleRange}"
                          />
        </s:SciChartSurface.YAxis>
But it is not working. I tried to bind Axes instead of VisibleRange only, but I got the same result. Any suggestions?
Thanks
- Alexander Erkabaev asked 5 years ago
