SciChart for Avalonia XPF v2.0 Released!
SciChart is thrilled to announce the release of SciChart for Avalonia XPF 2.0 – a major update that brings all features and improvements […]
We are pleased to announce release of SciChart.js v4. You can try out version 4 right now. This is a huge release with many new features, but before we get to that these are useful links:
1. We did our best to test v4 and to fix all the bugs we have found, but if there is something that requires out attention please report it at support.scichart.com or SciChart.js forum, making clear which version you are using.
2. For v4 we have created a new documentation web-site which you will find here – www.scichart.com/documentation/js/v4. It contains new functionality we have introduced in v4 and updated docs for old features. There is a convenient search in the upper-right corner of the page.
3. We have updated tutorials and boilerplates repos on our GitHub.
4. This is a major release that has breaking changes, though these are mostly small and easy to update. We have a detailed list, including how to update at Breaking Changes in v4.

This release is all about adding more in-demand charting possibilities, the biggest of which is polar charts. Our polar charts support line, column, mountain, band, scatter and heatmap series. Few charting libraries let you adjust polar charts with rotating and tilting layouts. Whenever you specify the rotation and total angle and inner radius, SciChart will automatically size and position the chart.
Discover some of the latest polar chart possibilities in the image gallery.
 Polar Stacked Mountain Chart
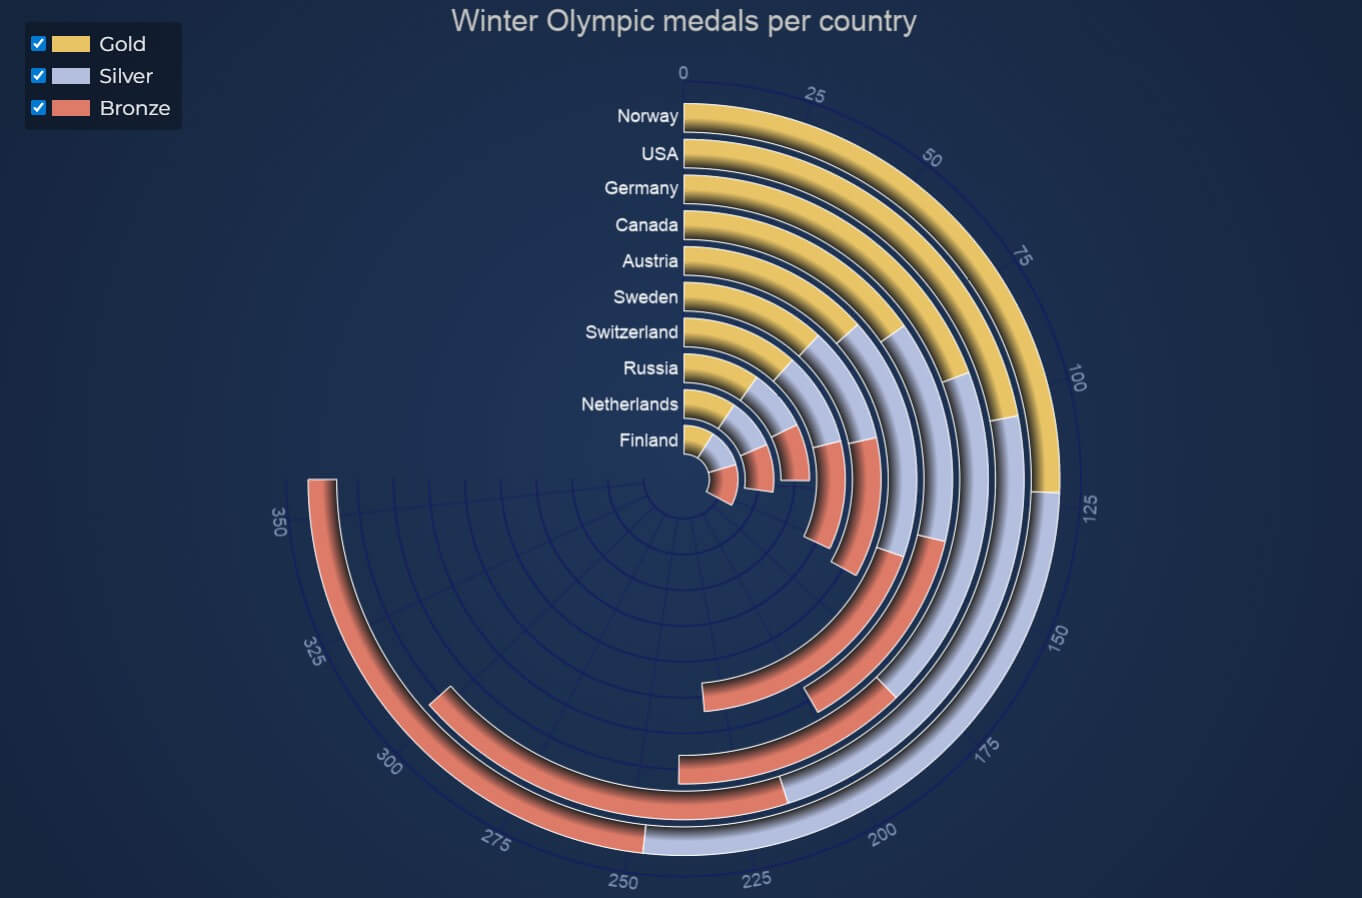
 Polar Heatmap
 Polar Scatter Chart
 Radar Chart
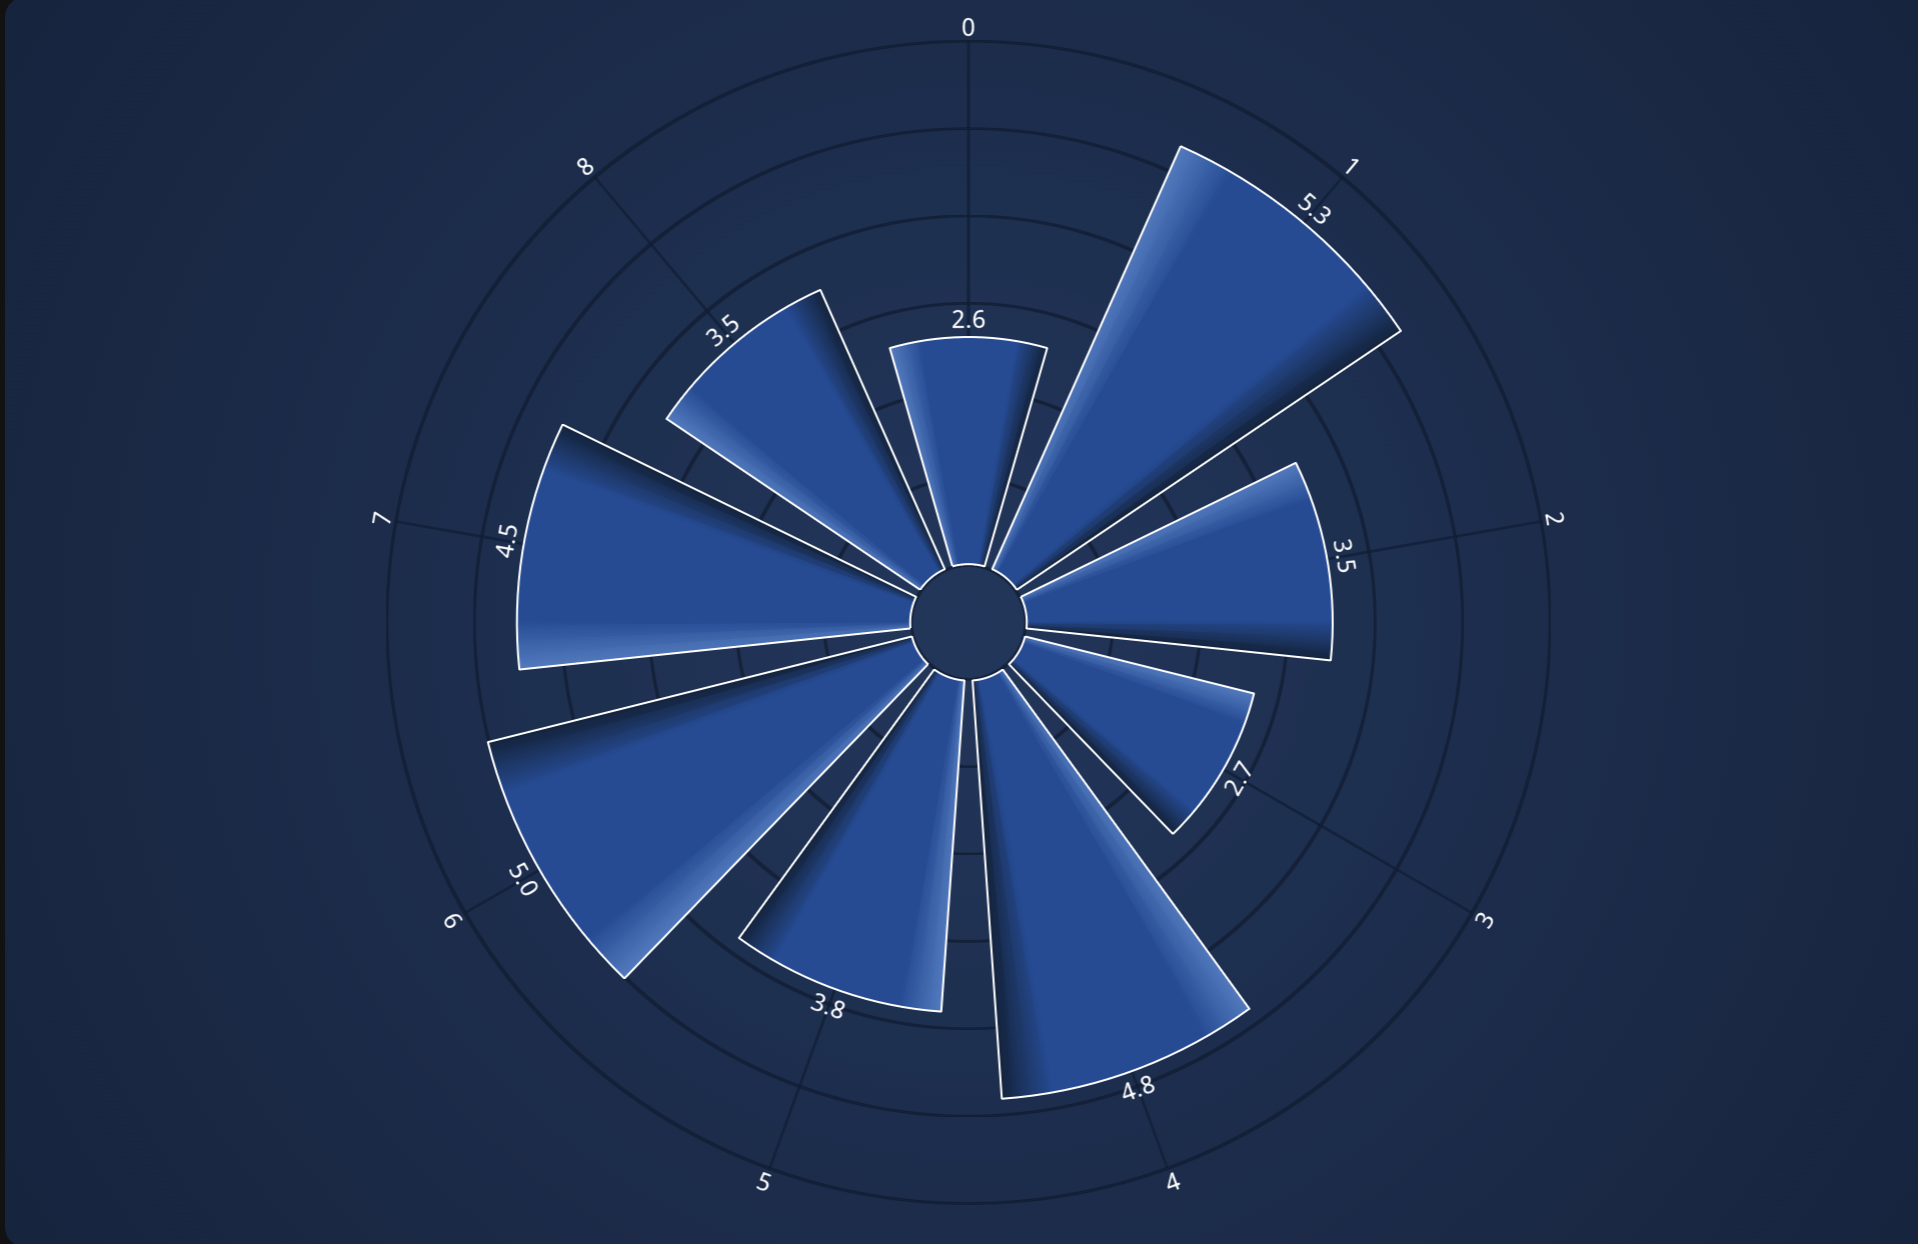 Polar Area Chart
Check out Polar Chart Live Demos here.

We’ve added the capability to draw Geo Maps to SciChart.js, using GeoJSON as an input data source. Create Choropleth maps, world maps, US State maps allowing per-country, per state or per region coloring and outlining, in incredible high detail (500k+ triangles).
Compared to other libraries like D3.js SciChart.js allows you to generate & view GeoJSON maps far faster with far higher details due to WebGL and WebAssembly rendering. Above is an example of a React Choropleth map, a type of thematic map where areas are shaded or patterned in proportion to the value of a variable being represented, using our FastTriangleRenderableSeries.
You will find live Geo JSON (Choropleth) Maps demo here.

Until now we’ve shied away from creating gauges in our javascript chart library however it was so frequently requested to that we’ve added both Linear and Radial gauges to SciChart.js.
This is highly configurable and allows to render radial and linear gauges with full customization of data labels, rounded corners, gradient palettes, animations and realtime updates.
Click the links to check out live Radial Gauges Demo and Linear Gauges Demo.
 Box Plot Chart
 Triangle Series
 Treemap Chart
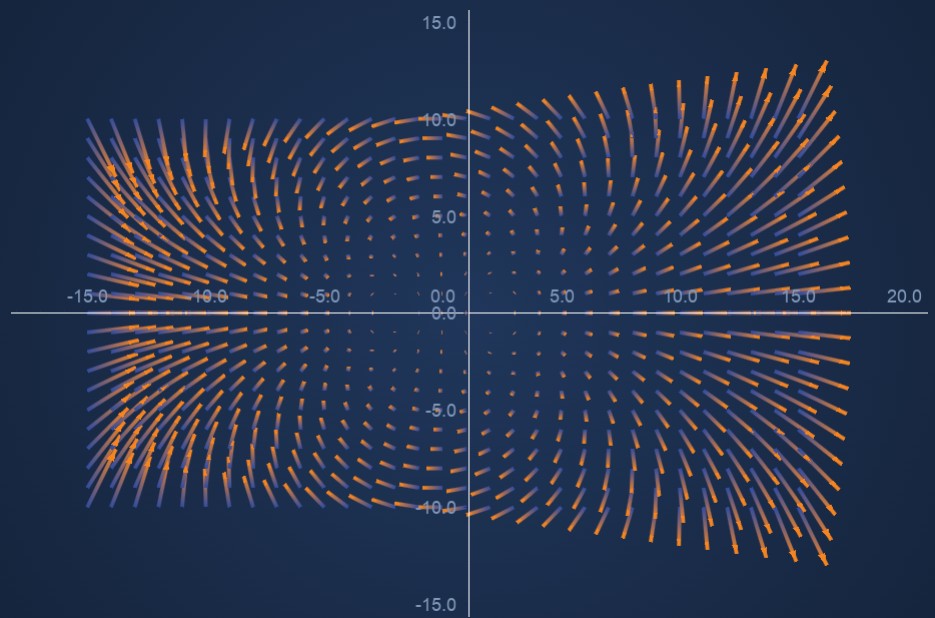 Vector Field
We also introduced new cartesian chart types such as rectangle, box plot, line-segment, triangle and polygon charts and implemented some useful features like texture fills. These new series types can take various data formats, so we have refactored the DataSeries to be able to have any number of arrays, e.g., Xyx, Xyxy, a 5-value format specifically for box plots, XyN for sharing x values between multiple series, and the ability to easily define whatever format you need. The new HTMLTextAnnotation and HTMLCustomAnnotation allow you to add more responsive content to the chart.
Click the links to check out live Box Plot Chart, Triangle Series, Treemap Chart and Vector Field demos.

We have fully revised and updated documentation web-site. It is easier to read, has a better navigation and leverages convenient search. Although it is not a charting library feature, but it is a great feature to be a productive developer when creating charts with SciChart.js.
You will find the new documentation here.
You will find the list of SciChart.js v4 features in the table below.
You will find other changes and fixes in the table below.
| Title | Description |
| Reduced SciChart.js bundle size (SCJS-1521, SCJS-1522, SCJS-1689) | Wasm file size has been optimized and scichart.data file (and scichart3d.data file) which contained various assets, has been merged into the main wasm file, shrinking the total size of the file to be loaded. Check out Deploying Wasm (WebAssembly) with your app docs |
| Emscripten update (SCJS-1702) | Emscripten has been updated to version 3.1.73 |
| Improved UpdateSuspender mechanism (SCJS-1706) | Batching updates or temporary suspending drawing mechanism has been improved. UpdateSuspender docs |
| Improved performance for 3D (SCJS-3122) | Performance for 3D has been improved by eliminating unnecessary re-rendering |
| BuilderAPI support for 3D (SCJS-1957) | Docs |
| Drawing subcharts outside of the visible range (SCJS-1697) | Allow subcharts to be drawn partially offscreen. Which make it possible to create examples like this one |
| SubCharts now support both Cartesian and Polar charts (SCJS-1654) | It is possible to combine both Polar and Cartesian charts on one surface. Check out docs |
| SubCharts layout issue with VerticalGroup (SCJS-1891) | The issue has been fixed for subcharts using both VerticalGroup and HorizontalGroup on the axes at the same time |
| Improved performance by defaulting axis labels to NativeText | SciChartDefaults.useNativeText has been changed to default to true, which means that by default, axis labels will be rendered using WebGL instead of by Canvas, unless useNativeText is set false on the axis or labelProvider. Check out NativeText API docs |
| Gridline drawing performance improvements (SCJS-1691) | Improved by using native vectors for storing tick coordinates |
| Simplified multi-axis API, by auto-generating Axis IDs (SCJS-1838) | AxisCore.DEFAULT_AXIS_ID has been removed. From now on value for AxisCore.id is an auto generated guid and there is now need to set axis IDs explicitly for a multi-axis scenarios. |
| SciChartSurface.zoomExtents() has got parameter to include selected axes (SCJS-1712) | You can use xAxisSelectorFn and yAxisSelectorFn selectors to filter out axes. Find more information here SciChartSurface.zoomExtents TypeDoc |
| Improved syncing widths of axes (SCJS-1634) | SciChartVerticalGroup and SynchronisedLayoutManager should synchronize the width of the axis viewRect as well as the total size so that axis backgrounds line up |
| XyNDataSeries to store data with multiple Y-values (SCJS-1807) | DataSeries has been refactor and XyNDataSeries has been introduced, which allows for storing data with multiple Y-values. Check out DataSeries docs |
| Gradient fill support for StackedColumnRenderableSeries | Gradient fill docs |
| zOffset property for UniformContoursRenderableSeries (SCJS-1915) | UniformContoursRenderableSeries.zOffset gives control at what Z-value the contour lines start |
| Ability to set renderable series name (SCJS-1824) | seriesName property has been added to IRenderableSeries.seriesName. This property is used in HitTestInfo.dataSeriesName and in tooltips and legends. |
| Per annotation clipping mode (SCJS-1745) | Annotations now have their own clipping property, which applies to both native and SVG annotations, allowing for more annotation types to be used over the axes. AnnotationBase.clipping TypeDoc |
| NativeTextAnnotation got background (SCJS-2094) | Now it is possible to set a background on NativeTextAnnotation. NativeTextAnnotation.background TypeDoc |
| Ability to clip Annotation Adorners to series area (SCJS-1655) | The standard behaviour is for adorners to extend, but some users need a different bahavior. Example code |
| Chart modifier’s axis and series inclusion API has been improved (SCJS-1711) | Axis and series inclusion are now standardized across modifiers. Check out TypeDocs ChartModifierBase2D.includedSeries, ChartModifierBase2D.includedXAxes, ChartModifierBase2D.includedYAxes |
| executeCondition API has been added to chart modifiers | ChartModifierBase.executeOn has been replaced by ChartModifierBase.executeCondition. This provides a general way of specifying when you want a modifier to activate based on both mouse button and ctrl/alt/shift keys. |
| Make pinch zoom enabled by default in ZoomPanModier (SCJS-1938) | ZoomPanModier docs |
| ClipPath Rect issue in Firefox (SCJS-1883) | This bug occurs when some specific conditions take place: clipPath has a single child element and clipped element has a child with position “absolute”. |
| Default delete on clear for ObverableArray to prevent memory leaks (SCJS-2062) | In ObservableArrays in remove, removeAt and clear methods default behaivior has changed to call delete on the removed item |
| cornerRadius Column Series bug has been fixed (SCJS-1301) | When FastColumnRenderableSeries.cornerRadius was set and StrokeThickness = 0, fillLinearGradient did not work |
We will continue to support version 3 with critical fixes for at least 6 months after v4 is fully released, but we encourage all users to update as soon as possible, as further features and fixes will only happen on v4.
Contact us to learn more
SciChart.js is a JavaScript Chart Library designed for complex, mission critical applications. Now with a FREE community edition. If you have a question or would like to learn more about our products & services, please contact us:
Related Posts
![]()
Queens Award for Innovation
Proud winners of the Queens Award for Innovation, 2019. Awarded on account of our innovative graphics engine which underpins the SciChart library and enables our world-beating charting performance
![]()
National Business Awards
Highly Commended for Lloyds National Business Awards, 2019. Awarded on account of our innovative graphics engine and impressive customer base
![]()
National Technology Awards
Awarded “Healthcare Tech of the Year” at the 2025 National Technology Awards – a top UK recognition for breakthrough innovation in technology.

Reviews
SciChart has received hundreds of verified, 3rd party reviews