Hi,
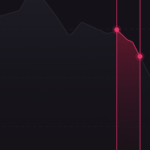
I set up my xAxis (DateAxis) with a minimalZoomConstrain = DateInterval.fromMinutes(3.0). And here is my PinchZoomModifier:
val pinchZoomModifier = PinchZoomModifier().apply {
        direction = Direction2D.XDirection
        receiveHandledEvents = true
    }
The chart works great and restricts the zoom to three minutes, but I get this error to the console whenever I zoom in to reach the minimalZoomConstrain:
E/Axis: VisibleRange was restored to its last valid value. The range class com.scichart.data.model.DateRange (Min = Tue Jan 09 01:52:40 GMT+01:00 2020, Max = Tue Jan 09 01:55:40 GMT+01:00 2020) either is not valid or it doesn't satisfy MinimalZoomConstrain or MaximumZoomConstrain. To provide fallback value please override AxisCore#coerceVisibleRange(IRange) method
How can I get rid of this error? Is there a way to tell the PinchZoomModifier that there is a min limit?
- Erika Sankari asked 4 years ago
- last active 4 years ago
I want to change the color of the fill bellow the chart(with blue using line chart,FastMountainRenderableSeries etc) but I have problem with defining the BrushStyle and it wont apply on chart(issue with color define-initPaint).Should I change the function ?or how to change default area color ?
- Guest asked 8 years ago
- last active 8 years ago
Hi,
Can you please tell me do you have tool like https://www.scichart.com/documentation/win/current/webframe.html#Fibonacci%20Retracement%20Drawing%20Tool.html
on Android?
If not, please give me a sample code on how to implement this with scichart.
Thanks in advance.
Regards,
Batyr
- Batyr Batyr asked 3 years ago
- last active 3 years ago
Hello! How i can create same style on select chart
i use public class XyCustomPaletteProvider extends PaletteProviderBase<XyRenderableSeriesBase> implements IFillPaletteProvider, IStrokePaletteProvider, IPointMarkerPaletteProvider { but i can pass only single color like this:
I try create three AreaStyle with gradient but nothing could be done…
use version SciChart 4.4.0.4739
- Sergey Evdokimov asked 1 year ago
- last active 1 year ago
i follow this way to update an exist candle
stockPrices.update(stockPrices.getCount() – 1, priceBar.getOpen(), priceBar.getHigh(), priceBar.getLow(), priceBar.getClose());
it work well but not so smooth, SciChart have any other way or trick to do this ?
Thank you
- tran hai asked 4 years ago
- last active 4 years ago
Hello Friends,
I'm looking a solution where i can change Y-Axis range in between (0.1,0.2,0.4,0.6,0.8,1.0) .
I appreciate any help for above question
Thanks
Vasim
- vasim simform asked 3 years ago
- last active 3 years ago
I set a rolloverModifier to a CandlestickSeries, but I can not find a API to hide RolloverMarker,I only find a article about WPF(https://www.scichart.com/documentation/v5.x/webframe.html#RolloverModifier.html), how could I hide RolloverMarker or change the style of RolloverMarker in Android?

- jiahao li asked 4 years ago
- last active 4 years ago
Hello! I am try to create chart with axis on top in my react native app, chart is create succesfuly, but when I start add annotation – it shift to top by axis height – whats may be wrong?
`
// create
surface = new CSciChartSurface(context);
surface.setRenderSurface(new RenderSurface(context));

// Initialize the SciChartBuilder
SciChartBuilder.init(context);

// Obtain the SciChartBuilder instance
sciChartBuilder = SciChartBuilder.instance();

 xAxis = sciChartBuilder
      .newCategoryDateAxis()
      .withTextFormatting(DateChartFormatter.defaultDateFormat)
      .withGrowBy(0.0d, 0.04d)
      .withDrawMajorGridLines(true)
      .withDrawMinorGridLines(false)
      .withDrawMajorBands(false)
      .withDrawMajorTicks(false)
      .withAxisAlignment(AxisAlignment.Top)
      .build();
// same yaxis and any

VerticalLineAnnotation verticalLine = sciChartBuilder.newVerticalLineAnnotation()
        .withPosition(10, 16)
        .withStroke(2, ColorUtil.Orange)
        .withIsEditable(true)
        .build();

Collections.addAll(surface.getYAxes(), yAxis);
Collections.addAll(surface.getXAxes(), xAxis);
Collections.addAll(surface.getRenderableSeries(), lineRenderableSeries);
Collections.addAll(surface.getAnnotations(), verticalLine);

// add to view
this.addView(surface);
`
- Sergey Evdokimov asked 1 year ago
- last active 1 year ago
I’m using a CategoryDateAxis and seeing the following crash many times in production. The issue is that SciChart is not synchronizing access to SimpleDateFormat, and this will lead to a crash.
Please see following thread for more details on how to fix this issue:
https://bugs.java.com/bugdatabase/view_bug.do?bug_id=6231579
Crash log:
java.lang.ArrayIndexOutOfBoundsException: length=6; index=-4
at sun.util.calendar.BaseCalendar.getCalendarDateFromFixedDate(BaseCalendar.java:453)
at java.util.GregorianCalendar.computeFields(GregorianCalendar.java:2411)
at java.util.GregorianCalendar.computeFields(GregorianCalendar.java:2321)
at java.util.Calendar.setTimeInMillis(Calendar.java:1787)
at java.util.Calendar.setTime(Calendar.java:1749)
at java.text.SimpleDateFormat.format(SimpleDateFormat.java:981)
at java.text.SimpleDateFormat.format(SimpleDateFormat.java:974)
at java.text.DateFormat.format(DateFormat.java:341)
at com.scichart.charting.numerics.labelProviders.TradeChartAxisLabelFormatter.formatLabel(SourceFile:124)
at com.scichart.charting.numerics.labelProviders.FormatterLabelProviderBase.formatLabel(SourceFile:70)
at com.scichart.charting.numerics.labelProviders.CategoryLabelProviderBase.formatLabel(SourceFile:113)
at com.scichart.charting.visuals.axes.AxisBase.formatText(SourceFile:1142)
at com.scichart.charting.visuals.axes.AxisInfo.update(SourceFile:87)
at com.scichart.charting.visuals.axes.AxisTooltip.update(SourceFile:83)
at com.scichart.charting.modifiers.behaviors.AxisTooltipsBehavior.a(SourceFile:84)
at com.scichart.charting.modifiers.behaviors.AxisTooltipsBehavior.updateXAxisTooltip(SourceFile:62)
at com.scichart.charting.modifiers.behaviors.AxisTooltipsBehaviorBase.a(SourceFile:165)
at com.scichart.charting.modifiers.behaviors.AxisTooltipsBehaviorBase.onUpdate(SourceFile:158)
at com.scichart.charting.modifiers.TooltipModifierWithAxisLabelsBase.handleMasterTouchMoveEvent(SourceFile:190)
at com.scichart.charting.modifiers.MasterSlaveTouchModifierBase$1.a(SourceFile:129)
at com.scichart.charting.modifiers.MasterSlaveTouchModifierBase$1.execute(SourceFile:125)
at com.scichart.charting.modifiers.MasterSlaveTouchModifierBase.a(SourceFile:70)
at com.scichart.charting.modifiers.MasterSlaveTouchModifierBase.onTouchMove(SourceFile:59)
at com.scichart.charting.modifiers.TouchModifierBase.onTouch(SourceFile:44)
at com.scichart.charting.modifiers.ModifierGroup.onTouch(SourceFile:189)
at com.scichart.core.utility.touch.MotionEventManager.c(SourceFile:140)
at com.scichart.core.utility.touch.MotionEventManager.a(SourceFile:39)
at com.scichart.core.utility.touch.MotionEventManager$a$1.a(SourceFile:224)
at com.scichart.core.utility.touch.MotionEventManager$a$1.execute(SourceFile:221)
at com.scichart.core.utility.touch.MotionEventManager$a.a(SourceFile:211)
at com.scichart.core.utility.touch.MotionEventManager$a.onTouchEvent(SourceFile:183)
at com.scichart.charting.visuals.SciChartSurface.onTouchEvent(SourceFile:1251)
at android.view.View.dispatchTouchEvent(View.java:11776)
at android.view.ViewGroup.dispatchTransformedTouchEvent(ViewGroup.java:2962)
at android.view.ViewGroup.dispatchTouchEvent(ViewGroup.java:2643)
at android.view.ViewGroup.dispatchTransformedTouchEvent(ViewGroup.java:2968)
at android.view.ViewGroup.dispatchTouchEvent(ViewGroup.java:2657)
at android.view.ViewGroup.dispatchTransformedTouchEvent(ViewGroup.java:2968)
at android.view.ViewGroup.dispatchTouchEvent(ViewGroup.java:2657)
at android.view.ViewGroup.dispatchTransformedTouchEvent(ViewGroup.java:2968)
at android.view.ViewGroup.dispatchTouchEvent(ViewGroup.java:2657)
at android.view.ViewGroup.dispatchTransformedTouchEvent(ViewGroup.java:2968)
at android.view.ViewGroup.dispatchTouchEvent(ViewGroup.java:2657)
at android.view.ViewGroup.dispatchTransformedTouchEvent(ViewGroup.java:2968)
at android.view.ViewGroup.dispatchTouchEvent(ViewGroup.java:2657)
at android.view.ViewGroup.dispatchTransformedTouchEvent(ViewGroup.java:2968)
at android.view.ViewGroup.dispatchTouchEvent(ViewGroup.java:2657)
at android.view.ViewGroup.dispatchTransformedTouchEvent(ViewGroup.java:2968)
at android.view.ViewGroup.dispatchTouchEvent(ViewGroup.java:2657)
at android.view.ViewGroup.dispatchTransformedTouchEvent(ViewGroup.java:2968)
09-02 01:42:23.356 17621-17621/? E/AndroidRuntime: at android.view.ViewGroup.dispatchTouchEvent(ViewGroup.java:2657)
at android.view.ViewGroup.dispatchTransformedTouchEvent(ViewGroup.java:2968)
at android.view.ViewGroup.dispatchTouchEvent(ViewGroup.java:2657)
at com.android.internal.policy.DecorView.superDispatchTouchEvent(DecorView.java:448)
at com.android.internal.policy.PhoneWindow.superDispatchTouchEvent(PhoneWindow.java:1829)
at android.app.Activity.dispatchTouchEvent(Activity.java:3307)
at android.support.v7.view.i.dispatchTouchEvent(WindowCallbackWrapper.java:68)
at android.support.v7.view.i.dispatchTouchEvent(WindowCallbackWrapper.java:68)
at com.android.internal.policy.DecorView.dispatchTouchEvent(DecorView.java:410)
at android.view.View.dispatchPointerEvent(View.java:12015)
at android.view.ViewRootImpl$ViewPostImeInputStage.processPointerEvent(ViewRootImpl.java:4795)
at android.view.ViewRootImpl$ViewPostImeInputStage.onProcess(ViewRootImpl.java:4609)
at android.view.ViewRootImpl$InputStage.deliver(ViewRootImpl.java:4147)
at android.view.ViewRootImpl$InputStage.onDeliverToNext(ViewRootImpl.java:4200)
at android.view.ViewRootImpl$InputStage.forward(ViewRootImpl.java:4166)
at android.view.ViewRootImpl$AsyncInputStage.forward(ViewRootImpl.java:4293)
at android.view.ViewRootImpl$InputStage.apply(ViewRootImpl.java:4174)
at android.view.ViewRootImpl$AsyncInputStage.apply(ViewRootImpl.java:4350)
at android.view.ViewRootImpl$InputStage.deliver(ViewRootImpl.java:4147)
at android.view.ViewRootImpl$InputStage.onDeliverToNext(ViewRootImpl.java:4200)
at android.view.ViewRootImpl$InputStage.forward(ViewRootImpl.java:4166)
at android.view.ViewRootImpl$InputStage.apply(ViewRootImpl.java:4174)
at android.view.ViewRootImpl$InputStage.deliver(ViewRootImpl.java:4147)
at android.view.ViewRootImpl.deliverInputEvent(ViewRootImpl.java:6661)
at android.view.ViewRootImpl.doProcessInputEvents(ViewRootImpl.java:6635)
at android.view.ViewRootImpl.enqueueInputEvent(ViewRootImpl.java:6596)
at android.view.ViewRootImpl$WindowInputEventReceiver.onInputEvent(ViewRootImpl.java:6764)
at android.view.InputEventReceiver.dispatchInputEvent(InputEventReceiver.java:186)
at android.view.InputEventReceiver.nativeConsumeBatchedInputEvents(Native Method)
at android.view.InputEventReceiver.consumeBatchedInputEvents(InputEventReceiver.java:177)
at android.view.ViewRootImpl.doConsumeBatchedInput(ViewRootImpl.java:6735)
at android.view.ViewRootImpl$ConsumeBatchedInputRunnable.run(ViewRootImpl.java:6787)
at android.view.Choreographer$CallbackRecord.run(Choreographer.java:911)
at android.view.Choreographer.doCallbacks(Choreographer.java:723)
at android.view.Choreographer.doFrame(Choreographer.java:652)
at android.view.Choreographer$FrameDisplayEventReceiver.run(Choreographer.java:897)
at android.os.Handler.handleCallback(Handler.java:790)
at android.os.Handler.dispatchMessage(Handler.java:99)
at android.os.Looper.loop(Looper.java:164)
at android.app.ActivityThread.main(ActivityThread.java:6494)
at java.lang.reflect.Method.invoke(Native Method)
at com.android.internal.os.RuntimeInit$MethodAndArgsCaller.run(RuntimeInit.java:438)
at com.android.internal.os.ZygoteInit.main(ZygoteInit.java:807)
09-02 01:42:35.433 2145-2162/? E/BatteryExternalStatsWorker: modem info is invalid: ModemActivityInfo{ mTimestamp=0 mSleepTimeMs=0 mIdleTimeMs=0 mTxTimeMs[]=[0, 0, 0, 0, 0] mRxTimeMs=0 mEnergyUsed=0}
Another crash:
java.lang.ArrayIndexOutOfBoundsException: length=13; index=15
at sun.util.calendar.BaseCalendar.getCalendarDateFromFixedDate(BaseCalendar.java:453)
at java.util.GregorianCalendar.computeFields(GregorianCalendar.java:2411)
at java.util.GregorianCalendar.computeFields(GregorianCalendar.java:2321)
at java.util.Calendar.setTimeInMillis(Calendar.java:1787)
at java.util.Calendar.setTime(Calendar.java:1749)
at java.text.SimpleDateFormat.format(SimpleDateFormat.java:981)
at java.text.SimpleDateFormat.format(SimpleDateFormat.java:974)
at java.text.DateFormat.format(DateFormat.java:341)
at com.scichart.charting.numerics.labelProviders.TradeChartAxisLabelFormatter.formatLabel(SourceFile:124)
at com.scichart.charting.numerics.labelProviders.FormatterLabelProviderBase.formatLabel(SourceFile:70)
at com.scichart.charting.numerics.labelProviders.CategoryLabelProviderBase.formatLabel(SourceFile:113)
at com.scichart.charting.visuals.axes.AxisBase.formatText(SourceFile:1142)
at com.scichart.charting.visuals.axes.AxisInfo.update(SourceFile:87)
at com.scichart.charting.visuals.axes.AxisTooltip.update(SourceFile:83)
at com.scichart.charting.modifiers.behaviors.AxisTooltipsBehavior.a(SourceFile:84)
at com.scichart.charting.modifiers.behaviors.AxisTooltipsBehavior.updateXAxisTooltip(SourceFile:62)
at com.scichart.charting.modifiers.behaviors.AxisTooltipsBehaviorBase.a(SourceFile:165)
at com.scichart.charting.modifiers.behaviors.AxisTooltipsBehaviorBase.onUpdate(SourceFile:158)
at com.scichart.charting.modifiers.TooltipModifierWithAxisLabelsBase.handleMasterTouchMoveEvent(SourceFile:190)
at com.scichart.charting.modifiers.MasterSlaveTouchModifierBase$1.a(SourceFile:129)
at com.scichart.charting.modifiers.MasterSlaveTouchModifierBase$1.execute(SourceFile:125)
at com.scichart.charting.modifiers.MasterSlaveTouchModifierBase.a(SourceFile:70)
at com.scichart.charting.modifiers.MasterSlaveTouchModifierBase.onTouchMove(SourceFile:59)
at com.scichart.charting.modifiers.TouchModifierBase.onTouch(SourceFile:44)
at com.scichart.charting.modifiers.ModifierGroup.onTouch(SourceFile:189)
at com.scichart.core.utility.touch.MotionEventManager.c(SourceFile:140)
at com.scichart.core.utility.touch.MotionEventManager.a(SourceFile:39)
at com.scichart.core.utility.touch.MotionEventManager$a$1.a(SourceFile:224)
at com.scichart.core.utility.touch.MotionEventManager$a$1.execute(SourceFile:221)
at com.scichart.core.utility.touch.MotionEventManager$a.a(SourceFile:211)
at com.scichart.core.utility.touch.MotionEventManager$a.onTouchEvent(SourceFile:183)
at com.scichart.charting.visuals.SciChartSurface.onTouchEvent(SourceFile:1251)
at android.view.View.dispatchTouchEvent(View.java:11779)
at android.view.ViewGroup.dispatchTransformedTouchEvent(ViewGroup.java:2965)
at android.view.ViewGroup.dispatchTouchEvent(ViewGroup.java:2643)
at android.view.ViewGroup.dispatchTransformedTouchEvent(ViewGroup.java:2971)
at android.view.ViewGroup.dispatchTouchEvent(ViewGroup.java:2657)
at android.view.ViewGroup.dispatchTransformedTouchEvent(ViewGroup.java:2971)
at android.view.ViewGroup.dispatchTouchEvent(ViewGroup.java:2657)
at android.view.ViewGroup.dispatchTransformedTouchEvent(ViewGroup.java:2971)
at android.view.ViewGroup.dispatchTouchEvent(ViewGroup.java:2657)
at android.view.ViewGroup.dispatchTransformedTouchEvent(ViewGroup.java:2971)
at android.view.ViewGroup.dispatchTouchEvent(ViewGroup.java:2657)
at android.view.ViewGroup.dispatchTransformedTouchEvent(ViewGroup.java:2971)
at android.view.ViewGroup.dispatchTouchEvent(ViewGroup.java:2657)
at android.view.ViewGroup.dispatchTransformedTouchEvent(ViewGroup.java:2971)
at android.view.ViewGroup.dispatchTouchEvent(ViewGroup.java:2657)
at android.view.ViewGroup.dispatchTransformedTouchEvent(ViewGroup.java:2971)
at android.view.ViewGroup.dispatchTouchEvent(ViewGroup.java:2657)
at android.view.ViewGroup.dispatchTransformedTouchEvent(ViewGroup.java:2971)
09-03 00:01:08.300 21932-21932/co.mikeliu.stocks E/AndroidRuntime: at android.view.ViewGroup.dispatchTouchEvent(ViewGroup.java:2657)
at android.view.ViewGroup.dispatchTransformedTouchEvent(ViewGroup.java:2971)
at android.view.ViewGroup.dispatchTouchEvent(ViewGroup.java:2657)
at com.android.internal.policy.DecorView.superDispatchTouchEvent(DecorView.java:448)
at com.android.internal.policy.PhoneWindow.superDispatchTouchEvent(PhoneWindow.java:1834)
at android.app.Activity.dispatchTouchEvent(Activity.java:3312)
at android.support.v7.view.WindowCallbackWrapper.dispatchTouchEvent(WindowCallbackWrapper.java:68)
at android.support.v7.view.WindowCallbackWrapper.dispatchTouchEvent(WindowCallbackWrapper.java:68)
at com.android.internal.policy.DecorView.dispatchTouchEvent(DecorView.java:410)
at android.view.View.dispatchPointerEvent(View.java:12018)
at android.view.ViewRootImpl$ViewPostImeInputStage.processPointerEvent(ViewRootImpl.java:4829)
at android.view.ViewRootImpl$ViewPostImeInputStage.onProcess(ViewRootImpl.java:4643)
at android.view.ViewRootImpl$InputStage.deliver(ViewRootImpl.java:4181)
at android.view.ViewRootImpl$InputStage.onDeliverToNext(ViewRootImpl.java:4234)
at android.view.ViewRootImpl$InputStage.forward(ViewRootImpl.java:4200)
at android.view.ViewRootImpl$AsyncInputStage.forward(ViewRootImpl.java:4327)
at android.view.ViewRootImpl$InputStage.apply(ViewRootImpl.java:4208)
at android.view.ViewRootImpl$AsyncInputStage.apply(ViewRootImpl.java:4384)
at android.view.ViewRootImpl$InputStage.deliver(ViewRootImpl.java:4181)
at android.view.ViewRootImpl$InputStage.onDeliverToNext(ViewRootImpl.java:4234)
at android.view.ViewRootImpl$InputStage.forward(ViewRootImpl.java:4200)
at android.view.ViewRootImpl$InputStage.apply(ViewRootImpl.java:4208)
at android.view.ViewRootImpl$InputStage.deliver(ViewRootImpl.java:4181)
at android.view.ViewRootImpl.deliverInputEvent(ViewRootImpl.java:6755)
at android.view.ViewRootImpl.doProcessInputEvents(ViewRootImpl.java:6694)
at android.view.ViewRootImpl.enqueueInputEvent(ViewRootImpl.java:6655)
at android.view.ViewRootImpl$WindowInputEventReceiver.onInputEvent(ViewRootImpl.java:6858)
at android.view.InputEventReceiver.dispatchInputEvent(InputEventReceiver.java:193)
at android.view.InputEventReceiver.nativeConsumeBatchedInputEvents(Native Method)
at android.view.InputEventReceiver.consumeBatchedInputEvents(InputEventReceiver.java:184)
at android.view.ViewRootImpl.doConsumeBatchedInput(ViewRootImpl.java:6829)
at android.view.ViewRootImpl$ConsumeBatchedInputRunnable.run(ViewRootImpl.java:6881)
at android.view.Choreographer$CallbackRecord.run(Choreographer.java:911)
at android.view.Choreographer.doCallbacks(Choreographer.java:723)
at android.view.Choreographer.doFrame(Choreographer.java:652)
at android.view.Choreographer$FrameDisplayEventReceiver.run(Choreographer.java:897)
at android.os.Handler.handleCallback(Handler.java:790)
at android.os.Handler.dispatchMessage(Handler.java:99)
at android.os.Looper.loop(Looper.java:164)
at android.app.ActivityThread.main(ActivityThread.java:6545)
at java.lang.reflect.Method.invoke(Native Method)
at com.android.internal.os.RuntimeInit$MethodAndArgsCaller.run(RuntimeInit.java:438)
at com.android.internal.os.ZygoteInit.main(ZygoteInit.java:809)
- Mike Liu asked 6 years ago
- last active 6 years ago
Hello all,
I’ve a question about the android chart,
I’ve see WPF include fft plotting support, but I didn’t see it in android ?
can you tell me if the android scichart have it ?
thanks
- Davy Thibaut asked 8 years ago
- last active 8 years ago
Is it possible?
Or make box annotations fit screen height?
(even when zooming)
- Vadim Kirey asked 5 years ago
- last active 5 years ago
Hi,
I have issue with export SciChart to Bitamp. I have to generate pdf report from data. Report contains two charts.
It is possible to render chart in memory and export to bitmap? I know it is possible in WPF but I couldn’t achive this in Android.
Now my solution is that I render this charts on fragments and wait 1s on each to render and then save chart. But this solution is not good. For slower devices chart is not exported correctly.
For example on one device have strange grid (only exported bitmap, fragment with this chart looks good):

- Marcin K asked 6 years ago
- last active 6 years ago
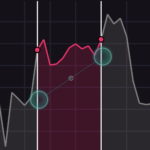
Hi, I want to draw a chart like the attached image.
This is a chart with XyDataSeries, it show as vertical line at each data point and verticle line is a dotted line in order to separated from other series.
Since the OHLC chart will have the open, close on the data point and an impulse chart is forced to draw from an axis, is there any better way that can achieve a series like this? Thank you!
- may lym asked 4 years ago
- last active 4 years ago
When using GLTextureView on Android 4.4 API 19, there are a few issues. The same issue does not occur on API 27. Have not tested other API levels. If you do not use GLTextureView, this issue doesn’t happen (but due to theming bugs I have to use GLTextureView and not the other 2 types of render surfaces).
-
If activity A has a SciChartSurface and activity B has a SciChartSurface and appears above activity A, then the surface in A dissapears (Shows blank) when you return to it. 100% repro for me. Let me know if you need more info.
-
Due to 1? If you try to re-render the chart on activity A, it will lead to an ANR (app freezes indefinitely) after a few times (see below)
-
Even if you don’t have activity B and only activity A, if you interact with it a few times and show/hide it, it will lead to an ANR (app freezes indefinitely) as well (see below):
ANR log (it freezes the app until you kill it):
09-03 13:01:40.583 1690-1705/system_process E/ActivityManager: ANR in co..stocks (co..stocks/.ui.screens.home.MainActivity)
PID: 12076
Reason: Input dispatching timed out (Waiting because the touched window has not finished processing the input events that were previously delivered to it.)
Load: 0.64 / 0.49 / 0.39
CPU usage from 6217ms to 779ms ago:
- Mike Liu asked 6 years ago
- last active 6 years ago
Hello!
I’m trying to migrate OhlcDataSeries from Double to more accurate BigDecimal on Android.
But I faced with an issue that “GenericClass doesn’t support class”
How can I fix it?
I want to use BigDecimal with chart.
Thank you
- Roman Z asked 3 years ago
- last active 3 years ago
I am using the examples app for Android and I am noticing that sometimes in the Line Chart example the background colour changes to black instead of the standard grey colour. Seems to be a random occurrence. I am currently testing on a Nexus 7 running 4.4.2. The problem doesn’t occur on my Nexus 4 running 5.1.1.
Thank you,
Andrew
- andrew tiernay asked 8 years ago
- last active 8 years ago
Hello,
At right chart we have show only one X-axis which needs to update in real time .whenever new values will come we have to update in X-axis in itself instead of adding new line at X-Axis.
Each time New Y – axis will come that will append at left chart (Can be consider left chart showing history of right chart)
Let me know if anything further requred
Thanks.
- vasim simform asked 3 years ago
- last active 3 years ago
This issue repros on Android 4.4 API 19, but not API 27. It happens with the example project (Multi-Pane Stock Charts). The issue is that on certain zoom levels, the x-axis labels are cut off (so instead of displaying 11 Mar, it just displays 11).
I have tried to override TradeChartAxisLabelFormatter with my custom implementation but saw the same issue, so the bug seems to be in the provider or somewhere else.
Please see screenshot: https://imgur.com/a/2RDC2MZ
- Mike Liu asked 6 years ago
- last active 6 years ago
Hi all,
Why the API’s for iOS, Android and WPF are not identically?
I have seen many samples on the forum, but to adapt it to a different platform is very hard.
A lot of classes are different for each platform.
- Is there any “comparison” for the different platforms?
- Is this planned to unify the API’s?
Regards
Urs
- Urs Geser asked 5 years ago
- last active 5 years ago
We are using single SurfaceMeshRenderableSeries3D chart and added multidata on condition click event but issue is sometime data is loaded or sometime not. So my question is how to refresh 3D chart after added new data ?
- vaibhav patel asked 3 years ago
- last active 3 years ago
In Xamarin.IOS when you set the legend to Horizontal and Top it will create a legend at the top then allow you to scroll horizontally to see all your LineSeries. In Xamarin.Android when you have more Series than can originally fit on the screen, the legend malfunctions and takes up the entire screen. Picture will be attached.
- Clifford Bateman asked 6 years ago
- last active 6 years ago
Hi,
Let me explain the structure of attached views. Default view state is https://imgur.com/a/zqAqpXp .
<VerticalViewPager>
    <FirstPagedFragment>
         <TradingViewFragment>
             <WebView />
         </TradingViewFragment>
         <SciChartFragment>
             <com.scichart.charting.visuals.SciChartSurface />
         </SciChartFragment>
    </FirstPagedFragment>
    <SecondPagedFragment>
           ...
    </ SecondPagedFragment>
</VerticalViewPager>
When FirstPagedFragment is dragged, SecondPagedFragment becomes displayed. You can see it on https://imgur.com/a/2VqZ1HY
The problem is the chart becomes disappeared when ViewPager is on changing state. Here is another link : https://imgur.com/a/xDO6Xtx
It is happened on [Samsung Galaxy S9, API 26] and [Xiaomi Mi A1, API 25] and I did not update displayMetric of chart.
Is there any configuration to fix this issue? Thanks.
All images are attached.
- Changhee Lee asked 6 years ago
- last active 6 years ago
I have a line chart and need to implement textAlign: left property for tickLabel on yAxis. I have found some way to do it on the forum, but it does not work in my case:
xAxis.setAxisTickLabelStyle(new AxisTickLabelStyle(Gravity.CENTER, Layout.Alignment.ALIGN_CENTER, 5, 0, 5, 0));
I get the error:
Alignment cannot be converted to int
But according documentation https://www.scichart.com/documentation/android/current/SciChart.Charting~com.scichart.charting.visuals.axes.AxisTickLabelStyle~_ctor.html AxisTickLabelStyle class get 5 int arguments. Can you help me please how to solve it!
- Alexander Kishchak asked 3 years ago
- last active 3 years ago
I was wondering about the possibilities to show markers. I dug a while in the examples and played with default interactions, which use dragging to update the position of the marker.
On mobile devices this conflicts a little with the pan interaction to move the chart. I saw there’s also the possibility to pan using the axes area. There’s also the possibility to just tap on the chart, which doesn’t conflict with other interactions, to show a marker, but I couldn’t find how to do this. At least there doesn’t seem to be built in support for it? How should this be done?
Additionally I would like once a marker appears to either be able to update only by tapping again at other place on the chart (simple solution) or temporarily disabling the panning such that this gesture only moves the marker and not the chart (preferred, but probably less simple solution). So tapping on the chart would enter “marker mode” which disables zooming and panning and some other gesture – e.g. using an external button on the chart, would leave “marker mode” and enter zoom/pan mode again.
Any ideas how to achieve this? Thanks in advance!
P.S. I’m also using a real time chart, though this probably doesn’t make a difference concerning this.
- Ivan Schütz asked 7 years ago
- last active 7 years ago
I want to make my labels positions in the centre of axis (y axis which is transparent). Only three labels have to be showed. On the same height with the min, max and actual points. How can I achieve this.

- Iliya Mashin asked 2 years ago
- last active 2 years ago
Hi
I have a line chart that has already been drawn and synced with a sound.
when we play sound, chart begin to scroll horizontally.
but problem is lagging when scrolling chart.
Is there a way to fix this problem?
private Runnable mRunnable = new Runnable() {
    @Override
    public void run() {
        forceRunInPauseMode = false;

        getActivity().runOnUiThread(() -> {
            currentTime = (int) exoPlayer.getCurrentPosition();
            binding.tvCurrentDuration.setText(MiliToTimeConverter.milliToTime(currentTime));
        });

        int currentRange = currentTime * 2;


        if (!isDraw) {
            DoubleValues xValues = new DoubleValues(Arrays.copyOfRange(xDoubleArray, 0, xDoubleArray.length - 1));
            DoubleValues yValues = new DoubleValues(Arrays.copyOfRange(yDoubleArray, 0, yDoubleArray.length - 1));
            DoubleSeries doubleSeries = new DoubleSeries(xValues, yValues);
            lineData.append(doubleSeries.getxValues(), doubleSeries.getyValues());
            isDraw = true;
        }
        xVisibleRange.setMinMax(currentRange - visibleInterval / 2, currentRange + visibleInterval / 2);
    }
};

private void updateChart() {
    schedule = scheduledExecutorService.scheduleWithFixedDelay(() -> {
        if (!isPlaying && !forceRunInPauseMode)
            return;
        UpdateSuspender.using(binding.sciChart, mRunnable);
    }, 0, TIME_INTERVAL, TimeUnit.MILLISECONDS);
}


private void pause() {
    exoPlayer.setPlayWhenReady(false);
    binding.ivPlay.setImageResource(R.drawable.ic_play);
    if (schedule != null)
        schedule.cancel(false);
}

private void initSciChart() {

    isChartConfigured = true;
    SciChartBuilder.init(getContext());
    binding.sciChart.setBackgroundColor(getResources().getColor(R.color.colorTransparent));

    // Obtain the SciChartBuilder instance
    SciChartBuilder mSciChartBuilder = SciChartBuilder.instance();

    //set border style
    binding.sciChart.setRenderableSeriesAreaBorderStyle(null);

    xVisibleRange = new DoubleRange();

    // Create a numeric X axis
    final IAxis xAxis = mSciChartBuilder.newNumericAxis()
            .withVisibleRange(xVisibleRange)
            .withGrowBy(new DoubleRange(0.25d * visibleInterval / totalDuration, 0.25d * visibleInterval / totalDuration))
            .withAutoRangeMode(AutoRange.Never)
            .build();

    final IAxis yAxis = mSciChartBuilder.newNumericAxis()
            .withVisibleRange(-1d, 1d)
            .withAutoRangeMode(AutoRange.Never)
            .build();

    xAxis.setVisibleRangeChangeListener((iAxisCore, oldRange, newRange, isAnimating) -> {
        if (!isPlaying) {
            double c = ((newRange.getMinAsDouble() + newRange.getMaxAsDouble()) / 4);
            getActivity().runOnUiThread(() -> binding.tvCurrentDuration.setText(MiliToTimeConverter.milliToTime((long) c)));
        }
    });


    xAxis.setDrawMajorGridLines(false);
    xAxis.setDrawMinorGridLines(false);
    xAxis.setDrawMajorBands(false);
    xAxis.setDrawMajorTicks(true);
    xAxis.setDrawMinorTicks(true);
    xAxis.setTickProvider(new CustomTickProvider());
    xAxis.setMaxAutoTicks(MAX_AUTO_TICKS);
    xAxis.setMinorsPerMajor(MINOR_PER_MAJOR);
    xAxis.setVisibility(View.GONE);


    yAxis.setDrawMajorGridLines(false);
    yAxis.setDrawMinorGridLines(false);
    yAxis.setDrawMajorBands(false);
    yAxis.setDrawMajorTicks(false);
    yAxis.setDrawMinorTicks(false);
    yAxis.setTickProvider(new CustomTickProvider());
    yAxis.setMaxAutoTicks(MAX_AUTO_TICKS);
    yAxis.setMinorsPerMajor(MINOR_PER_MAJOR);
    yAxis.setVisibility(View.GONE);


    VerticalLineAnnotation verticalLine = mSciChartBuilder.newVerticalLineAnnotation()
            .withX1(0.5)   // black
            .withStroke(new SolidPenStyle(ColorUtil.argb(250, 120, 126, 136), true, 1f, null))
            .withCoordinateMode(AnnotationCoordinateMode.RelativeX)
            .build();

    ModifierGroup chartModifiers = mSciChartBuilder.newModifierGroup()
            .withModifier(new GestureModifierBase() {
                @Override
                public void detach() {
                    super.detach();
                }

                @Override
                public boolean onFling(MotionEvent e1, MotionEvent e2, float velocityX, float velocityY) {
                    return false;
                }

                @Override
                public boolean onScroll(MotionEvent e1, MotionEvent e2, float distanceX, float distanceY) {
                    // Scroll X
                    xAxis.scroll((-distanceX/2), ClipMode.ClipAtExtents);

                    return true;
                }
            })
            .build();

    lineData = mSciChartBuilder.newXyDataSeries(Double.class, Double.class).build();
    XyDataSeries staticData = mSciChartBuilder.newXyDataSeries(Double.class, Double.class).build();

    final FastLineRenderableSeries lineSeries = mSciChartBuilder.newLineSeries()
            .withDataSeries(lineData)
            //.withPointMarker(mSciChartBuilder.newPointMarker(new EllipsePointMarker()).withSize(7, 7).withStroke(0xFF006400, 1).withFill(0xFFFFFFFF).build())
            .withPaletteProvider(new XYCustomPaletteProvider(ColorUtil.argb(255, 50, 153, 0))) // green
            .withStrokeStyle(ColorUtil.argb(250, 120, 126, 136), 1f, true) // black
            .build();

    final IRenderableSeries staticLineSeries = mSciChartBuilder.newLineSeries()
            .withDataSeries(staticData)
            .withPaletteProvider(new XYCustomPaletteProvider(ColorUtil.argb(255, 50, 153, 0))) // green
            .withStrokeStyle(ColorUtil.argb(250, 120, 126, 136), 1f, true) // black
            .build();

    DoubleValues xValues = new DoubleValues(Arrays.copyOfRange(xDoubleArray, 0, totalRange));
    DoubleValues yValues = new DoubleValues(Arrays.copyOfRange(yDoubleArray, 0, totalRange));
    DoubleSeries doubleSeries = new DoubleSeries(xValues, yValues);

    binding.sciChart.getRenderableSeries().add(lineSeries);
    binding.sciChart.getRenderableSeries().add(staticLineSeries);

    binding.sciChart.setRenderSurface(new RenderSurface(getContext()));

    Collections.addAll(binding.sciChart.getYAxes(), yAxis);
    Collections.addAll(binding.sciChart.getXAxes(), xAxis);
    Collections.addAll(binding.sciChart.getChartModifiers(), chartModifiers);
    Collections.addAll(binding.sciChart.getAnnotations(), verticalLine);

    staticData.append(doubleSeries.getxValues(), doubleSeries.getyValues());
    lineData.setAcceptsUnsortedData(true);

    begin();
}
- abolfazl ghanbari asked 4 years ago
- last active 4 years ago
