SciChart® the market leader in Fast WPF Charts, WPF 3D Charts, iOS Chart, Android Chart and JavaScript Chart Components
Please note! These examples are new to SciChart Mobile v3 release! SciChart iOS & Android ship with Xamarin.iOS and Xamarin.Android bindings around our native iOS & Android Chart controls, allowing you to create fast & feature rich charts to your Xamarin applications. We include ~90 native iOS examples and 90 Android examples, but now also ~60 Xamarin Chart Examples to help you get started with SciChart. You can download the source for our Xamarin Chart Examples from Github, or browse the source code below.
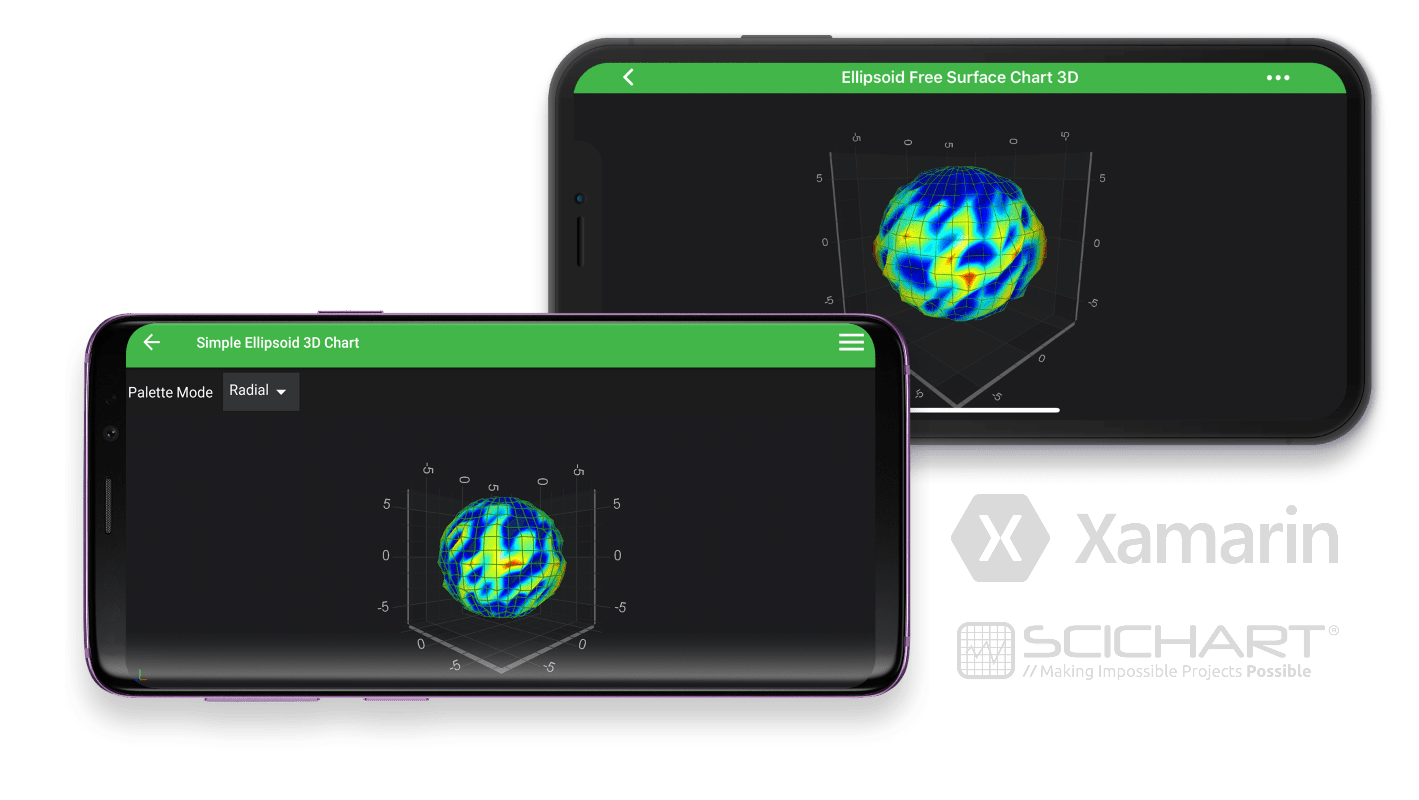
This is an example of Ellipsoid 3D Mesh. It shows how to use Free Surface Renderable series in realtime with SciChart Xamarin bindings to render the Geoid 3D in realtime.
See more in Documentation for the Free Surface Mesh and realtime updates: Plotting realtime Data in Xamarin.iOS 3DPlotting realtime Data in Xamarin.Android 3DEllipsoid 3D Chart Type iOSEllipsoid 3D Type Android
The C#/Xamarin.iOS/Xamarin.Android source code for the Xamarin Simple Ellipsoid 3D Chart example is included below (Scroll down!).
Did you know you can also view the source code from one of the following sources as well?
using System;
using SciChart.iOS.Charting;
using Xamarin.Examples.Demo.Utils;
namespace Xamarin.Examples.Demo.iOS
{
[Example3DDefinition("Ellipsoid 3D Chart", description: "Create a simple Ellipsoid 3D Chart", icon: ExampleIcon.Surface3D)]
class EllipsoidMesh3DChartViewController : SingleChartViewController<SCIChartSurface3D>
{
protected override void InitExample()
{
const int uSize = 40, vSize = 20;
var dataSeries3D = new EllipsoidDataSeries3D<double>(uSize, vSize) { A = 6, B = 6, C = 6 };
var random = new Random();
for (int u = 0; u < uSize; u++)
{
for (int v = 0; v < vSize; v++)
{
var weightV = 1d - Math.Abs(2d * v / vSize - 1d);
var offset = random.NextDouble();
dataSeries3D.SetDisplacement(u, v, offset * weightV);
}
}
var rSeries3D = new SCIFreeSurfaceRenderableSeries3D
{
DataSeries = dataSeries3D,
DrawMeshAs = SCIDrawMeshAs.SolidWireframe,
Stroke = 0x77228B22,
ContourInterval = 0.1f,
ContourStroke = 0x77228B22,
StrokeThickness = 1f,
MeshColorPalette = new SCIGradientColorPalette(
new[] { ColorUtil.Sapphire, ColorUtil.Blue, ColorUtil.Cyan, ColorUtil.GreenYellow, ColorUtil.Yellow, ColorUtil.Red, ColorUtil.DarkRed },
new[] { 0, .1f, .3f, .5f, .7f, .9f, 1 }),
PaletteMinimum = new SCIVector3(0, 6, 0),
PaletteMaximum = new SCIVector3(0, 7, 0),
};
using (Surface.SuspendUpdates())
{
Surface.XAxis = new SCINumericAxis3D { VisibleRange = new SCIDoubleRange(-7, 7) };
Surface.YAxis = new SCINumericAxis3D { VisibleRange = new SCIDoubleRange(-7, 7) };
Surface.ZAxis = new SCINumericAxis3D { VisibleRange = new SCIDoubleRange(-7, 7) };
Surface.RenderableSeries.Add(rSeries3D);
Surface.ChartModifiers.Add(CreateDefault3DModifiers());
Surface.WorldDimensions = new SCIVector3(200, 200, 200);
}
}
}
}
using System;
using System.Drawing;
using SciChart.Charting3D.Common.Math;
using SciChart.Charting3D.Model;
using SciChart.Charting3D.Model.DataSeries.FreeSurface;
using SciChart.Charting3D.Modifiers;
using SciChart.Charting3D.Visuals;
using SciChart.Charting3D.Visuals.Axes;
using SciChart.Charting3D.Visuals.Camera;
using SciChart.Charting3D.Visuals.RenderableSeries.Data;
using SciChart.Charting3D.Visuals.RenderableSeries.FreeSurface;
using SciChart.Core.Utility;
using SciChart.Data.Model;
using Xamarin.Examples.Demo.Data;
using Xamarin.Examples.Demo;
using Xamarin.Examples.Demo.Droid.Extensions;
using Xamarin.Examples.Demo.Droid.Fragments.Base;
namespace Xamarin.Examples.Demo.Droid.Fragments.Examples3D
{
[Example3DDefinition("Simple Ellipsoid 3D Chart", description: "Create a simple Ellipsoid 3D Chart", icon: ExampleIcon.Surface3D)]
class CreateEllipsoidMesh3DChartFragment : ExampleBaseFragment
{
public SciChartSurface3D Surface => View.FindViewById<SciChartSurface3D>(Resource.Id.chart3d);
public override int ExampleLayoutId => Resource.Layout.Example_Single_3D_Chart_Fragment;
protected override void InitExample()
{
const int uSize = 40, vSize = 20;
var dataSeries3D = new EllipsoidDataSeries3D<double>(uSize, vSize)
{
A = 6d,
B = 6d,
C = 6d
};
var random = new Random();
for (int u = 0; u < uSize; u++)
{
for (int v = 0; v < vSize; v++)
{
var weightV = 1d - Math.Abs(2d * v / vSize - 1d);
var offset = random.NextDouble();
dataSeries3D.SetDisplacement(u, v, offset * weightV);
}
}
var renderableSeries3D = new FreeSurfaceRenderableSeries3D()
{
DataSeries = dataSeries3D,
DrawMeshAs = DrawMeshAs.SolidWireframe,
StrokeColor = Color.FromArgb(0x77, 0x22, 0x8B, 0x22),
ContourInterval = 0.1f,
ContourStrokeColor = Color.FromArgb(0x77, 0x22, 0x8B, 0x22),
StrokeThickness = 1f.ToDip(Activity),
MeshColorPalette = new GradientColorPalette(
new Color[] { Color.FromArgb(0xFF, 0x1D, 0x2C, 0x6B), Color.Blue, Color.Cyan, Color.GreenYellow, Color.Yellow, Color.Red, Color.DarkRed },
new float[] { 0, .1f, .3f, .5f, .7f, .9f, 1 }),
PaletteMinMaxMode = FreeSurfacePaletteMinMaxMode.Relative,
PaletteMinimum = new Vector3(0, 6, 0),
PaletteMaximum = new Vector3(0, 7, 0),
PaletteRadialFactor = 1f,
PaletteAxialFactor = new Vector3(0, 0, 0),
PaletteAzimuthalFactor = 0f,
PalettePolarFactor = 0f
};
using (Surface.SuspendUpdates())
{
Surface.WorldDimensions.Assign(200, 200, 200);
Surface.XAxis = new NumericAxis3D() { VisibleRange = new DoubleRange(-7, 7) };
Surface.YAxis = new NumericAxis3D() { VisibleRange = new DoubleRange(-7, 7) };
Surface.ZAxis = new NumericAxis3D() { VisibleRange = new DoubleRange(-7, 7) };
Surface.Camera = new Camera3D();
Surface.RenderableSeries.Add(renderableSeries3D);
Surface.ChartModifiers = new ChartModifier3DCollection
{
new PinchZoomModifier3D(),
new OrbitModifier3D(),
new ZoomExtentsModifier3D()
};
}
}
}
}