Android Chart - Examples
SciChart Android ships with ~90 Android Chart Examples which you can browse, play with, view the source-code and even export each SciChart Android Chart Example to a stand-alone Android Studio project. All of this is possible with the new and improved SciChart Android Examples Suite, which ships as part of our Android Charts SDK.
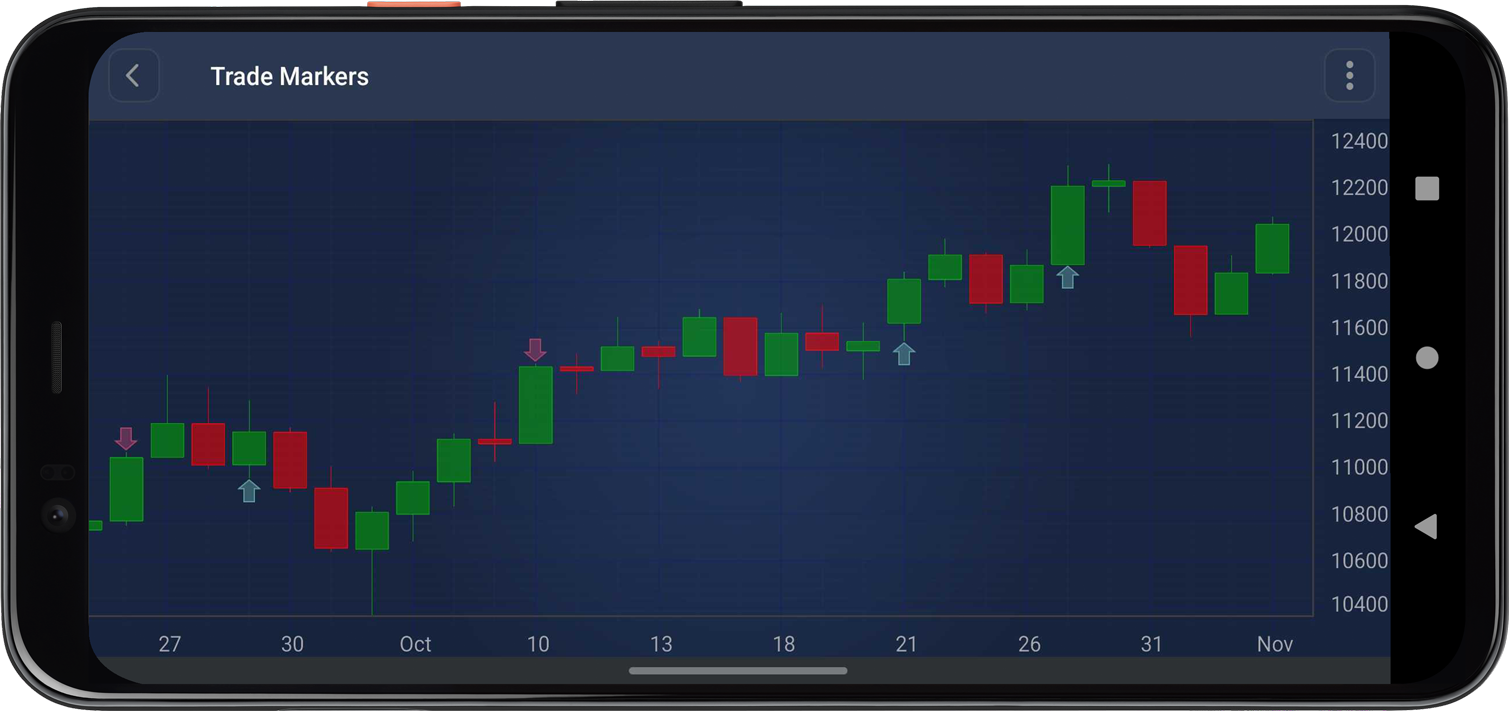
You can add trade markers (buy/sell arrows) to your charts using TradeMarkerAnnotation.
Create a TradeMarkerAnnotation using the constructor that takes the context, X-axis value (timestamp/index), Y-axis value (price), and an isBuy boolean indicating whether it’s a buy or sell marker:
val sellMarker = TradeMarkerAnnotation(context, x, y, false)
surface.getAnnotations().add(sellMarker)
The full source code for the Android TradeMarkerAnnotation implementation example is included below (Scroll down!).
Did you know you can also view the source code from one of the following sources as well?
- Clone the SciChart.Android.Examples from GitHub.
- Or, view source and export each example to an Android Studio project from the Java version of the SciChart Android Examples app.
- Also the SciChart Android Trial contains the full source for the examples (link below).
TradeMarkersFragment.java
View source code//******************************************************************************
// SCICHART® Copyright SciChart Ltd. 2011-2021. All rights reserved.
//
// Web: http://www.scichart.com
// Support: support@scichart.com
// Sales: sales@scichart.com
//
// TradeMarkersFragment.java is part of SCICHART®, High Performance Scientific Charts
// For full terms and conditions of the license, see http://www.scichart.com/scichart-eula/
//
// This source code is protected by international copyright law. Unauthorized
// reproduction, reverse-engineering, or distribution of all or any portion of
// this source code is strictly prohibited.
//
// This source code contains confidential and proprietary trade secrets of
// SciChart Ltd., and should at no time be copied, transferred, sold,
// distributed or made available without express written permission.
//******************************************************************************
package com.scichart.examples.fragments.examples2d.createStockCharts;
import androidx.annotation.NonNull;
import com.scichart.charting.model.dataSeries.IOhlcDataSeries;
import com.scichart.charting.model.dataSeries.OhlcDataSeries;
import com.scichart.charting.visuals.SciChartSurface;
import com.scichart.charting.visuals.annotations.TradeMarkerAnnotation;
import com.scichart.charting.visuals.axes.AutoRange;
import com.scichart.charting.visuals.axes.IAxis;
import com.scichart.charting.visuals.renderableSeries.FastCandlestickRenderableSeries;
import com.scichart.core.framework.UpdateSuspender;
import com.scichart.examples.data.DataManager;
import com.scichart.examples.data.PriceSeries;
import com.scichart.examples.fragments.base.ExampleSingleChartBaseFragment;
import java.util.Collections;
import java.util.Date;
import java.util.List;
import java.util.Random;
public class TradeMarkersFragment extends ExampleSingleChartBaseFragment {
@Override
protected void initExample(@NonNull SciChartSurface surface) {
PriceSeries priceSeries = DataManager.getInstance().getPriceDataIndu(getActivity());
int size = priceSeries.size();
// Use a subset of data for better visualization
int startIndex = Math.max(0, size - 100);
int endIndex = size;
int dataSize = endIndex - startIndex;
// Create data series with subset of data
IOhlcDataSeries<Date, Double> dataSeries = new OhlcDataSeries<>(Date.class, Double.class);
List<Date> dateData = priceSeries.getDateData();
List<Double> openData = priceSeries.getOpenData();
List<Double> highData = priceSeries.getHighData();
List<Double> lowData = priceSeries.getLowData();
List<Double> closeData = priceSeries.getCloseData();
for (int i = startIndex; i < endIndex; i++) {
dataSeries.append(dateData.get(i), openData.get(i), highData.get(i),
lowData.get(i), closeData.get(i));
}
// Set visible range relative to the data series (0-based indices)
// Show last 30 points, but ensure we don't go below 0
int visibleStart = Math.max(0, dataSize - 30);
int visibleEnd = dataSize;
final IAxis xAxis = sciChartBuilder.newCategoryDateAxis()
.withVisibleRange(visibleStart, visibleEnd)
.withGrowBy(0, 0.1)
.build();
final IAxis yAxis = sciChartBuilder.newNumericAxis()
.withGrowBy(0d, 0.1d)
.withAutoRangeMode(AutoRange.Always)
.build();
final FastCandlestickRenderableSeries rSeries = sciChartBuilder.newCandlestickSeries()
.withStrokeUp(0xFF00AA00)
.withFillUpColor(0x8800AA00)
.withStrokeDown(0xFFFF0000)
.withFillDownColor(0x88FF0000)
.withDataSeries(dataSeries)
.build();
UpdateSuspender.using(surface, () -> {
Collections.addAll(surface.getXAxes(), xAxis);
Collections.addAll(surface.getYAxes(), yAxis);
Collections.addAll(surface.getRenderableSeries(), rSeries);
Collections.addAll(surface.getChartModifiers(), sciChartBuilder.newModifierGroupWithDefaultModifiers().build());
// Simulate random trading algorithm
simulateTradingAlgorithm(surface, dataSeries);
});
}
/**
* Simulates a trading algorithm and adds trade markers to the chart.
*/
private void simulateTradingAlgorithm(SciChartSurface surface,
IOhlcDataSeries<Date, Double> dataSeries) {
Random random = new Random(42);
List<Date> dateValues = dataSeries.getXValues();
List<Double> lowValues = dataSeries.getLowValues();
List<Double> highValues = dataSeries.getHighValues();
List<Double> closeValues = dataSeries.getCloseValues();
// Initialize with some starting position so we can have sells from the beginning
double firstPrice = !closeValues.isEmpty() ? closeValues.get(0) : 1000;
double balance = 5000000; // Cash available for buying
double position = 500; // Starting with some shares
double avgPrice = firstPrice; // Average purchase price
double equity = position * firstPrice; // Initial equity value
for (int i = 0; i < dateValues.size(); i++) {
double low = lowValues.get(i);
double high = highValues.get(i);
double close = closeValues.get(i);
// Random price within the candle range
double price = low + random.nextDouble() * (high - low);
// 20% chance of trading
if (random.nextDouble() < 0.2) {
double t = equity / (equity + balance);
if (random.nextDouble() > t) {
// Buy
double quantity = Math.floor((random.nextDouble() * balance) / price);
double size = quantity * price;
avgPrice = (avgPrice * position + size) / (position + quantity);
position += quantity;
balance -= size;
// Add buy marker at low price
// CategoryDateAxis uses numeric indices (0-based) for positioning
TradeMarkerAnnotation buyMarker = new TradeMarkerAnnotation(
getContext(),
(double) i, // Use numeric index (0-based) for CategoryDateAxis
low,
true/*,
quantity,
price,
avgPrice*/
);
surface.getAnnotations().add(buyMarker);
} else {
// Sell
double quantity = Math.floor((random.nextDouble() * equity) / price);
double size = quantity * price;
position -= quantity;
balance += size;
//double pnl = (price - avgPrice) * quantity;
// Add sell marker at high price
// CategoryDateAxis uses numeric indices (0-based) for positioning
TradeMarkerAnnotation sellMarker = new TradeMarkerAnnotation(
getContext(),
(double) i, // Use numeric index (0-based) for CategoryDateAxis
high,
false/*,
quantity,
price,
pnl*/
);
surface.getAnnotations().add(sellMarker);
}
}
equity = position * close;
}
}
}
TradeMarkersFragment.kt
View source code//******************************************************************************
// SCICHART® Copyright SciChart Ltd. 2011-2021. All rights reserved.
//
// Web: http://www.scichart.com
// Support: support@scichart.com
// Sales: sales@scichart.com
//
// TradeMarkersFragment.kt is part of SCICHART®, High Performance Scientific Charts
// For full terms and conditions of the license, see http://www.scichart.com/scichart-eula/
//
// This source code is protected by international copyright law. Unauthorized
// reproduction, reverse-engineering, or distribution of all or any portion of
// this source code is strictly prohibited.
//
// This source code contains confidential and proprietary trade secrets of
// SciChart Ltd., and should at no time be copied, transferred, sold,
// distributed or made available without express written permission.
//******************************************************************************
package com.scichart.examples.fragments.examples2d.createStockCharts.kt
import com.scichart.charting.model.dataSeries.IOhlcDataSeries
import com.scichart.charting.visuals.SciChartSurface
import com.scichart.charting.visuals.annotations.TradeMarkerAnnotation
import com.scichart.charting.visuals.axes.AutoRange
import com.scichart.data.model.DoubleRange
import com.scichart.examples.data.DataManager
import com.scichart.examples.fragments.base.ExampleSingleChartBaseFragment
import com.scichart.examples.utils.scichartExtensions.*
import java.util.*
import kotlin.math.floor
class TradeMarkersFragment : ExampleSingleChartBaseFragment() {
override fun initExample(surface: SciChartSurface) {
val priceSeries = DataManager.getInstance().getPriceDataIndu(activity)
val size = priceSeries.size
// Use a subset of data for better visualization
val startIndex = maxOf(0, size - 100)
val endIndex = size
val dataSize = endIndex - startIndex
// Create data series with subset of data
val ohlcDataSeries = OhlcDataSeries<Date, Double>()
val dateData = priceSeries.dateData
val openData = priceSeries.openData
val highData = priceSeries.highData
val lowData = priceSeries.lowData
val closeData = priceSeries.closeData
for (i in startIndex until endIndex) {
ohlcDataSeries.append(dateData[i], openData[i], highData[i],
lowData[i], closeData[i])
}
// Set visible range relative to the data series (0-based indices)
// Show last 30 points, but ensure we don't go below 0
val visibleStart = maxOf(0, dataSize - 30)
val visibleEnd = dataSize
surface.suspendUpdates {
xAxes {
categoryDateAxis {
visibleRange = DoubleRange(visibleStart.toDouble(), visibleEnd.toDouble())
growBy = DoubleRange(0.0, 0.1)
}
}
yAxes {
numericAxis {
growBy = DoubleRange(0.0, 0.1)
autoRange = AutoRange.Always
}
}
renderableSeries {
fastCandlestickRenderableSeries {
dataSeries = ohlcDataSeries
strokeUpStyle = SolidPenStyle(0xFF00AA00)
fillUpBrushStyle = SolidBrushStyle(0x8800AA00)
strokeDownStyle = SolidPenStyle(0xFFFF0000)
fillDownBrushStyle = SolidBrushStyle(0x88FF0000)
}
}
chartModifiers {
defaultModifiers()
}
// Simulate random trading algorithm
simulateTradingAlgorithm(surface, ohlcDataSeries)
}
}
/**
* Simulates a trading algorithm and adds trade markers to the chart.
*/
private fun simulateTradingAlgorithm(surface: SciChartSurface,
dataSeries: IOhlcDataSeries<Date, Double>) {
val random = Random(42)
val dateValues = dataSeries.xValues
val lowValues = dataSeries.lowValues
val highValues = dataSeries.highValues
val closeValues = dataSeries.closeValues
// Initialize with some starting position so we can have sells from the beginning
val firstPrice = if (closeValues.isNotEmpty()) closeValues[0] else 1000.0
var balance = 5000000.0 // Cash available for buying
var position = 500.0 // Starting with some shares
var avgPrice = firstPrice // Average purchase price
var equity = position * firstPrice // Initial equity value
for (i in dateValues.indices) {
val low = lowValues[i]
val high = highValues[i]
val close = closeValues[i]
// Random price within the candle range
val price = low + random.nextDouble() * (high - low)
// 20% chance of trading
if (random.nextDouble() < 0.2) {
val t = equity / (equity + balance)
if (random.nextDouble() > t) {
// Buy
val quantity = floor((random.nextDouble() * balance) / price)
val size = quantity * price
avgPrice = (avgPrice * position + size) / (position + quantity)
position += quantity
balance -= size
// Add buy marker at low price
// CategoryDateAxis uses numeric indices (0-based) for positioning
val buyMarker = TradeMarkerAnnotation(
context,
i.toDouble(), // Use numeric index (0-based) for CategoryDateAxis
low,
true/*,
quantity,
price,
avgPrice*/
)
surface.annotations.add(buyMarker)
} else {
// Sell
val quantity = floor((random.nextDouble() * equity) / price)
val size = quantity * price
position -= quantity
balance += size
//val pnl = (price - avgPrice) * quantity
// Add sell marker at high price
// CategoryDateAxis uses numeric indices (0-based) for positioning
val sellMarker = TradeMarkerAnnotation(
context,
i.toDouble(), // Use numeric index (0-based) for CategoryDateAxis
high,
false/*,
quantity,
price,
pnl*/
)
surface.annotations.add(sellMarker)
}
}
equity = position * close
}
}
}
