JavaScript Chart - Examples
SciChart.js ships with over 80 JavaScript Chart demos which you can browse, view the source code and see related documentation. Build incredible complex dashboards with SciChart.js, our High Performance JavaScript Chart Library.
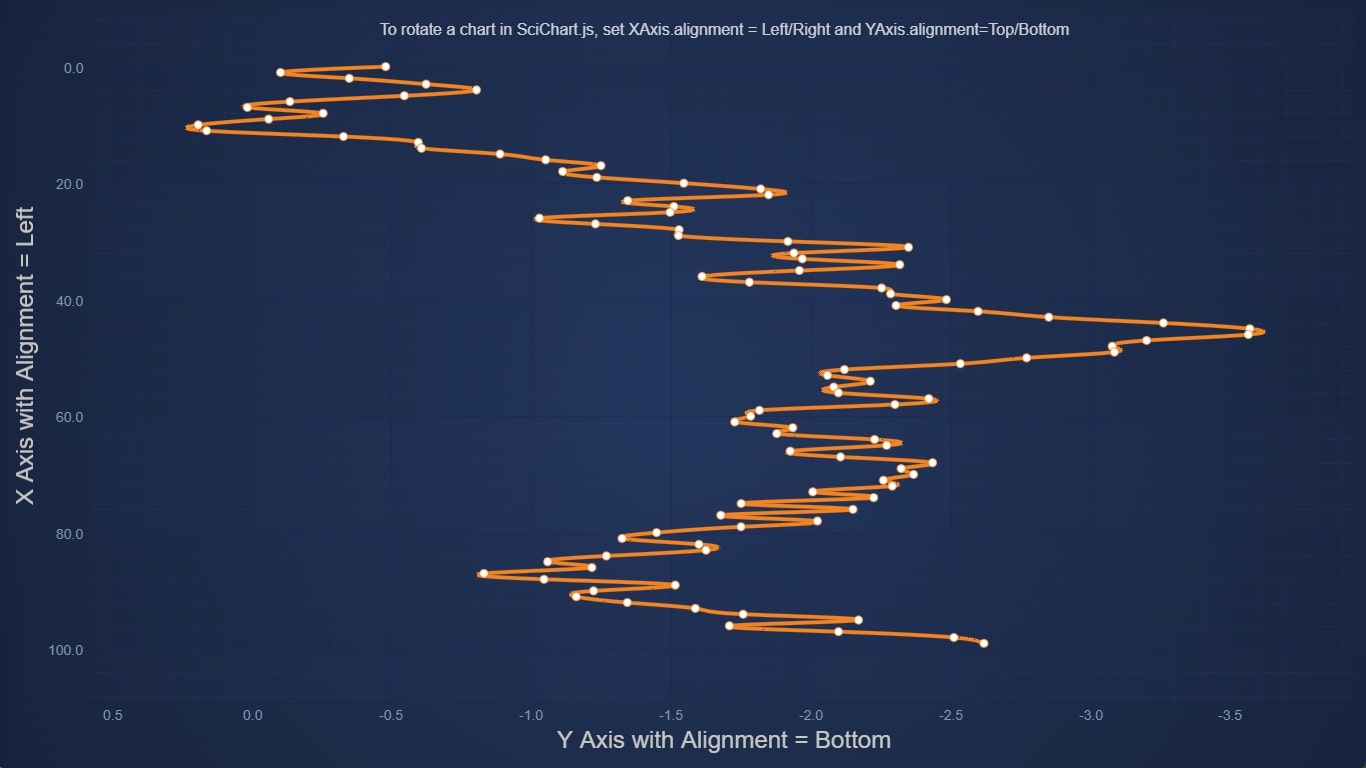
Demonstrates how to create a rotated JavaScript Chart with vertical X-Axis using SciChart.js, High Performance JavaScript Charts
Demonstrates a vertical chart with XAxis on the Left and YAxis on the Top. SciChart.js supports unlimited X and Y axis and allows placement of any axis on the Left, Right, Top, Bottom of the chart.
Tip
The vertical chart, popular in Oil & Gas, Geo-surveying, is created by setting xAxis.axisAlignment = Left, and yAxis.axisAlignment = top.
Try dragging an axis or the chart to zoom and pan around. Double clicking the chart resets the zoom!

