I have combed through KB articles and other documentations and samples here and SO, but I am not able to fix the issue. I am desperate for any help.
I have a react app that shows the chart, but at the top of the page, I have a header section and the remaining height is filled with Chart. All the samples and answers that I have seen thus far has no header section on the page. So the chart is 100% filled within it’s container. But, in my case the chart does not fit its container width & height and I end up with a scroll-bar. This is especially evident when you maximize the page (Chrome maximize window).
I am on Windows 10.
I have attached the code and a screen-shot of what the resulting page in Chrome. I have tried with and without CSS and it made no difference in terms of chart filling its container.
React Code:
import { useCallback, useEffect, useState } from 'react';
import { createRoot } from 'react-dom/client';
import './Chart-styles.scss';
import { SciChartSurface } from 'scichart/Charting/Visuals/SciChartSurface';
import { NumericAxis } from 'scichart/Charting/Visuals/Axis/NumericAxis';
import { getSciChartLicense } from '../common/chartUtils';

const Chart = () => {
const [chartId] = useState('line-chart');

const initChartAsync = useCallback(async () => {
    const { sciChartSurface, wasmContext } = await SciChartSurface.create(chartId);

    const xAxis = new NumericAxis(wasmContext);
    const yAxis = new NumericAxis(wasmContext);
    sciChartSurface.xAxes.add(xAxis);
    sciChartSurface.yAxes.add(yAxis);
}, []);

useEffect(() => {
    SciChartSurface.setRuntimeLicenseKey(getSciChartLicense());
    initChartAsync()
        .catch(error => {
            console.error('ChartRenderer | useEffect | initChartAsync failed!', error);
        });
}, [chartId]);

return (
    <div className="App">
        <div className='App-header'>
            <h2>Chart Header</h2>
            <h3>Chart Sub-Header</h3>
        </div>
        <div
            id={chartId}
            style={{width: '100%', height: '100%'}}
        />
    </div>
);
};

const container = document.getElementById('app');
const root = createRoot(container!);
root.render(<Chart/>);
Chart-Style.scss
#app {
    display: flex;
    flex-flow: column nowrap;
    margin: 0;
    padding: 0;
}

.App {
    flex: 1 1 auto;
    display: flex;
    flex-flow: column nowrap;
    text-align: center;
}

.App-header {
    flex: 0 1 auto;
    display: flex;
    flex-flow: column nowrap;
    background-color: #855b24;
    color: white;
    h2 {
        background-color: #2e2e2d;
        flex: 0 1 auto;
        margin: 0;
        padding: 2px;
    }
    h3 {
        background-color: #5c5c5b;
        flex: 0 1 auto;
        margin: 0;
        padding: 2px;
    }
}

#line-chart {
    flex: 1 1 auto;
}
- sachin patel asked 2 years ago
- last active 2 years ago
I have a real time updated chart and users can add annotation to the chart. The position of the annotation will be updated with the chart data. I would like to stop updating the annotation position while user dragging the annotation. So I added a flag (e.g. isDragging) to the annotation dragStarted and dragEnded events. The isDragging flag will be set to true in dragStarted and then set to false in dragEnded. I will check this flag before updating the annotation position.
Here’s the problem, the annotation dragStarted event will be triggered when users do panning in the chart. But the dragEnded will not be triggered in this case. It breaks my plan to stop updating the annotation position as the isDragging will be incorrect. Is it a bug that the annotation dragStarted event (but not the dragEnded event) triggered when panning?
- Quyen Sy asked 1 year ago
- last active 1 year ago
- Roman Gavrilow asked 3 years ago
- last active 3 years ago
RenderableSeries Hit-Test is not working as expected. Some bugs on the the RenderableSeries Hit-Test. Distance between two points are less then its working most of the time and getting the isHit variable getting true. But the distance is high then the lines near to the point only getting the isHit true. I am attaching the image when the red marked area is working fine and the blue marked area not working.
- Arun Surendran asked 3 years ago
- last active 3 years ago
I need to set range for stock chart from some records(first today’s record, first record of day before yesterday, etc for week, month, start of current year and the first record of chart) to last record.
To set the range i need to get indexes of this rows. Tell me please how can i do this for stock xValues. May be i can mark some records to find if faster or i need to check every records from 0 to MAX and then select the range?
Thank you!
- Yevhenii Krasovskyi asked 11 months ago
- last active 11 months ago
I am considering applying server-side licensing for my javerScript application.
In the document below, there is a phrase “Our server-side licensing component is written in C++.”
(https://support.scichart.com/index.php?/Knowledgebase/Article/View/17256/42/)
However, there is only asp.net sample code on the provided github.
(https://github.com/ABTSoftware/SciChart.JS.Examples/tree/master/Sandbox/demo-dotnet-server-licensing)
I wonder if there is a sample code implemented in C++ for server-side licensing.
Can you provide c++ sample code?
Also, are there any examples to run on Ubuntu?
- Christopher Aliotta asked 3 years ago
- last active 1 month ago
This is my first time in this forum, and I am analyzing SCIChart. I am planning to use it in my software, but there are some questions I haven’t been able to answer yet.
My software is similar to an IDE, where the user can build their custom applications and run on windows environment, but we also provide an option to save all the interface in html and javascript. Since SCIChart provides not only WPF Charts but also javascript Charts, I would like to know the following:
1- Does the javascript charts have the same functionalities as the wpf charts? XY Charts or Pie charts for example, will they have the same functionalities in WPF and Javascript ?
2- Does the appearence of the charts in WPF and Javascript are the same? Do they look exatcly the same?
I believe these are my biggest doubts so far. Thanks in advance !!
- Fabio Pereira de Carvalho asked 1 year ago
- last active 1 year ago
My application supports two themes (dark/light) for the charts. The background of the chart will be set to black if the dark mode is applied, and white if the light mode applied. It works well with the line chart. But there is strange grey background appeared in the heatmap chart when light mode is applied (Please check the attached screenshots). The color of gradient stop of offset 0 (min. heatmap zValues) is set to transparent and it works well with the dark mode. Do you know what’s wrong in my case?
Dark theme object applied to the chart:
{...new SciChartJSDarkTheme(), ...{
        sciChartBackground: "#1c1c1c",
        axisTitleColor: "#dee2e6",
        labelBorderBrush: "#dee2e6",
        tickTextBrush: "#dee2e6",
        majorGridLineBrush: "#1F3D68",
        minorGridLineBrush: "#102A47",
    }
Light theme object applied to the chart:
{...new SciChartJSLightTheme(), ...{
        sciChartBackground: "#fff",
        axisTitleColor: "#333",
        labelBorderBrush: "#333",
        tickTextBrush: "#333",
    }}
Heatmap graditentStops:
[
    { offset: 1, color: COLORS.DARK_RED },
    { offset: 0.8, color: COLORS.RED },
    { offset: 0.6, color: COLORS.YELLOW },
    { offset: 0.5, color: COLORS.GREEN },
    { offset: 0.4, color: COLORS.BLUE },
    { offset: 0.01, color: COLORS.DARK_BLUE },
    { offset: 0, color: "Transparent" },
]
- Quyen Sy asked 12 months ago
Hi!
Currently, I’m using Axis Layout – vertically stacked axes。When I use vertically stacked axes, click on a certain area, can I get on that axis? It’s from click on a certain area, not the series. I know the series can it.
can you give me some help?
- Jiawei Zhang asked 1 year ago
- last active 8 months ago
I am implementing a waterfall chart with non-uniforma heatmap. I found that the live update doesn’t work. I keep updating the zValues with live data but the chart just show 1 row of data. If I resize the chart (my heatmap is inside a resizable container), I can see the updated data (i.e. Each time I resize the chart, the chart updated and show updated data). Do you have any example of live updated non-uniform heatmap? Below are my codes:
Draw the heatmap:
const SPECTROGRAM_HEIGHT = 256;
const SPECTROGRAM_WIDTH = 100;

const { sciChartSurface, wasmContext } = await SciChartSurface.create("spectrogram-chart-root");

const xAxis = new NumericAxis(wasmContext, {
    axisTitle: "Frequency",
    axisTitleStyle: {
        fontSize: CHART_STYLE.AXIS_FONT_SIZE,
        fontFamily: "sans-serif",
        fontWeight: "bold"
    },
    labelStyle: {
        fontSize: CHART_STYLE.LABEL_FONT_SIZE,
        fontFamily: "sans-serif"
    },
    labelFormat: ENumericFormat.Decimal,
    labelPrecision: 6,
    cursorLabelFormat: ENumericFormat.Decimal,
    cursorLabelPrecision: 6,
    drawMajorBands: false,
});

const yAxis = new NumericAxis(wasmContext, {
    axisTitle: "Time",
    axisTitleStyle: {
        fontSize: CHART_STYLE.AXIS_FONT_SIZE,
        fontFamily: "sans-serif",
        fontWeight: "bold"
    },
    labelStyle: {
        fontSize: CHART_STYLE.LABEL_FONT_SIZE,
        fontFamily: "sans-serif"
    },
    drawMajorBands: false,
});

// Add XAxis and YAxis
sciChartSurface.xAxes.add(xAxis);
sciChartSurface.yAxes.add(yAxis);

const colorMap = new HeatmapColorMap({
    minimum: -200,
    maximum: -50,
    gradientStops: [
    { offset: 0, color: "Transparent" },
    { offset: 0.01, color: COLORS.DARK_BLUE },
    { offset: 0.4, color: COLORS.BLUE },
    { offset: 0.5, color: COLORS.GREEN },
    { offset: 0.6, color: COLORS.YELLOW },
    { offset: 0.8, color: COLORS.RED },
    { offset: 1, color: COLORS.DARK_RED },
    ]
});

// Create a Heatmap Data-series. Pass heatValues as a number[][] to the UniformHeatmapDataSeries
zValues = Array.from(Array(SPECTROGRAM_HEIGHT), () => Array(SPECTROGRAM_WIDTH).fill(-200));

const heatmapSeries = new NonUniformHeatmapRenderableSeries(wasmContext, {
    dataSeries: new NonUniformHeatmapDataSeries(wasmContext, { zValues: zValues, xCellOffsets: getHeatmapXOffset, yCellOffsets: getHeatmapYOffset }),
    colorMap: colorMap,
    useLinearTextureFiltering: true,
    fillValuesOutOfRange: true,
});

// Add heatmap to the chart
sciChartSurface.renderableSeries.add(heatmapSeries);
I simply return the index for testing in the getHeatmapXOffset and getHeatmapYOffset functions:
    const getHeatmapXOffset = (index) => {
    return index;
};

const getHeatmapYOffset = (index) => {
    return index;
};
Reset zValues when number of data point changed:
        spectrogramZValues = Array.from(Array(SPECTROGRAM_HEIGHT), () => Array(newWidth).fill(-200));
        heatmapSeries.dataSeries.setZValues(spectrogramZValues);
        sciChartSurface.zoomExtents();
Update the zValues array when there is new data (I tried to add call zoomExtens() after notifyDataChanged but still didn’t work):
    spectrogramZValues.shift();
    spectrogramZValues.push(newData);
    heatmapSeries.current.dataSeries.notifyDataChanged();
- Quyen Sy asked 1 year ago
- last active 1 year ago
Hi,
In the documentation I can’t see any way to make a chart surface fill the available space in all directions.
By default, it fills the available horizontal space, but the ratio of width:height remains fixed.
The only example I’ve seen where this is slightly different is this JS example, where the width flexes independently to fit the available space: https://demo.scichart.com/javascript-2d-3d-chart-tenor-curves-example – I’m not sure exactly what part of the code makes this different to the other examples?
My goal is to allow the user to adjust the height and width of any chart themselves by dragging the size of the container div, with the chart surface ideally just filling the space in a ‘dumb’ way, rather than using JS to manually update the chart size during the drag event.
Thanks,
Joe
- Henrique Rodrigues asked 3 years ago
- last active 2 years ago
Hey guys,
As you already know, I’ve implemented a wrapper of scichart.
In a clear Nuxt project, I can get the scichart.data / scichart.wasm files very well. Have no problems with that at all.
But on my current project, we can’t implement this because some dependency is missing from scichart. And without your code, I really don’t know how to get into it.
The image is on attachments. Can you help us?
Many thanks,
Pedro Cruz
- Ricardo Diz asked 3 years ago
- last active 3 years ago
Dear team. We have a need to draw footprint chart, but your library didnt’t have opportunity to draw it. It will be good if you help us with recommendations in which direction we should move to build it. Thanks you a lot !
- Ihor khmarskiy asked 3 years ago
- last active 9 months ago
Hi all,
I have another question about SciChart.js, I hope someone can teach me.
First, please download this video
This chart in video is made by d3.js, I hope I can use SciChart.js to make the same features,
please watch from 7 second to the end, when I click the mouse and move to the right direction, then click mouse again,
the section from first click to the second click will make different color, someone can teach me how to do that
PS: English is not my mother language, I wish you all can understand what I mean, Please download the video and watch, thanks.
- YEN-WEN WANG asked 4 years ago
- last active 3 years ago
Hi,
I’m trying to implement a market footprint with SciChart framework, I mean is possible create like a plugin for implement in the framework?
My idea was set body color of all the candles invisible and than for every candle set two volume series in horizontal like in the image.
- John Lepre asked 3 years ago
- last active 5 months ago
How do I insert gaps in a heatmap series? At the moment null values seem to show as either the max value colour or the min value colour.
- Henrique Rodrigues asked 3 years ago
- last active 3 years ago
Hi, I noticed that Heattexture: [object Object] is logged hundreds/thousands of times while interacting with a heatmap. This isn’t my console log, as it is a very simple implementation and there are no logs on my front end, with nothing called Heattexture in my repository.
I’m guessing that this is a leftover console log that needs to be removed, as it occurs in both my development and production Webpack builds.
Most of the time it does not cause any performance issues, but once I did see the heatmap flickering at roughly the same rate of the console log.
Screenshot attached.
Thanks!
- Henrique Rodrigues asked 3 years ago
- last active 3 years ago
I have been working with the new Overview Chart feature available in the new 2.0.0-beta.2084 release, and ran into an issue where I can remove lines from the overview surface no problem, but then I always receive an error whenever I try to add one.
I was just wondering if there is a recommended flow for when a parent chart’s renderable series array has traces added or removed. One thing I did try to circumvent this issue was to delete the old overview and add a new one, but I receive either a separate error or the overview would draw without any traces.
I have attached a file with example code that should display the error I receive when you add a line to an overview component. I have also attached an image of the error that appears in the console.
- Drew Afshari asked 3 years ago
- last active 3 years ago
Hi,
I am using SciChart trial version to create a a simple line chart but when running an application for a while, I got this error in the dev console log – not sure what the root cause is but it seems to come from SciChart library
- Atanai W. asked 2 years ago
- last active 2 years ago
Good day,
I am evaluating the use of scichart.js as a charting tool for our web dashboard in an offline environment. As a way of testing, I am currently trying to deploy the build of demo-create-react-app from the SDK on IIS. The build works if deployed using serve -s build but I get this error when I try to deploy the build on IIS.
I would also like to confirm if Scichart.js can work in an offline environment since I saw in this forum post that SciChart gets the .wasm and .data files from the CDN.
- Yohann Gabrielle Ticzon asked 2 years ago
- last active 2 years ago
Hi all,
Today, I follow the Tutorial 01, but I can not set up the SciChart.js project,
I am sure that I do the same step like Tutorial,
some one can help me to realize the error messages?
Thanks a lot.
PS:error messages is attached file
Sincerely,
Alec
- YEN-WEN WANG asked 4 years ago
- last active 4 years ago
Screenshots attached.
To recreate:
- Create a chart
- Add a CursorModifier – default options is fine
- Either directly remove the modifier using .remove(modifier), or clear all using .clear()
Expected behaviour:
– Should remove the cursor modifier
Actual behaviour with bug:
– Crashes the page
This appears to be an issue with CursorModifier only (out of the 5 or 6 that I’ve tried). Other modifiers work as expected.
Traced the issue to this.parentSurface being undefined in CursorModifier.js, so when onDetach() is called, it errors.
Thanks!
Joe
- Henrique Rodrigues asked 3 years ago
- last active 3 years ago
Hi there,
I would like to use a column chart with labels. Our client tends to use really long names for these labels, so I was wondering if it is possible that these labels wrap. I could find no property in the docs or source that achieves this. The attached screenshot shows the current (and undesired) rendering.
The current behavior seems to be that labels in between are hidden when longer labels overlap them. Is this a configurable property? In our case, the labels may never be hidden.
Kind regards,
Tim Havinga
- Tim Havinga asked 3 years ago
- last active 3 years ago
Hi,
I’ve been following your instructions on linking multiple charts here: https://www.scichart.com/documentation/js/current/webframe.html#Tutorial%2009%20-%20Linking%20Multiple%20Charts.html
I have found that one chart in isolation runs at the full 60fps smoothness, but with each chart that is synchronised, it gets progressively slower until 5+ synced charts, at which point it becomes almost unusable. This is definitely an issue for our use-case, which will require a large number of synchronised charts.
This is currently using uniform heatmap charts only, I haven’t tried it with any others.
The issue occurs with and without data, i.e. a completely empty heatmap.
I also found that if I follow the instructions to the letter (i.e. a full two-directional link, with one chart pushing position changes to the other, and vice-versa), I get “Maximum depth exceeded” errors due to the infinite loop.
Am I doing something wrong? Are you able to recreate this issue?
Thanks
Joe
- Henrique Rodrigues asked 3 years ago
- last active 3 years ago
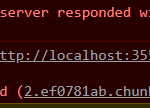
I was just going through the tutorial and had my project initializing the graph and drawing a few datapoints. Out of the blue after recently building with no new changes, I’ve been getting hit with the attached message. I’ve even tried deleting the scichart sub-folder within node_modules and reinstalling scichart via npm to no avail.
- Dylan Krupp asked 3 years ago
- last active 3 years ago
Hi,
In my application I am using two charts for represent different values. I am using LegendModifier on the first chart. Is it possible when i uncheck the series on first chart and the same color series on second chart also need to hide from the second chart. Any event callback function available in LegendModifier ?
- Arun Surendran asked 2 years ago
- last active 2 years ago
Hi,
Is it possible to specify that incoming zValues array matrix is an array of columns, instead of an array of rows?
e.g. if I pass this:
[
[1,2,3],
[4,5,6],
[7,8,9]
]
[1,2,3] is the first column, not the first row.
We want to avoid transposing this data manually before passing it to the heatmap, because our data arrives one column at a time via a websocket subscription, and the data is too large to efficiently re-transpose every time.
I can’t see anything in the docs or the code?
Thanks
Joe
- Henrique Rodrigues asked 3 years ago
- last active 3 years ago
Multiple instances of sci chart any appearance changes reflecting on other instances. When I changed the background of one instance the same is reflected in the other instance. I have updated with createSingle to resolve this issue, But i am getting one alert when using createSingle.
- Arun Surendran asked 3 years ago
- last active 3 years ago
Remove the white spaces on the chart when we using drawLabels: false. I am using multiple x-axes and no of x-axis increase the empty white space on the x-axis is also increasing.
- Jerin Mathew asked 3 years ago
- last active 3 years ago
Hello guys,
Can you provide an example how to implement scichart on SSR Frameworks like Nuxt or Next.js ? I am trying to understand how i can compile a simple chart using Nuxt, getting the .data/.wasm file but i have problem after building process.
Can you help?
Many thanks
Pedro Cruz
- Ricardo Diz asked 3 years ago
- last active 3 years ago
Hello,
We have multiple sets of data that we’d like to display as a Stacked Column. The problem is that our data is jagged, meaning each series may not have a value for every value on the x-axis (it’s a time series by day).
Is there any way to present this data without having to merge all the x-values in every dataset? These a very large sets and it just does not seem to be efficient to do this.
Thanks!
Chris
- Christopher Aliotta asked 3 years ago
- last active 3 years ago
Can you please provide an example or documentation on how to change the tooltip style? Is any method to turn off the cursor pointer for a particular data series?
- Jerin Mathew asked 3 years ago
- last active 3 years ago
Hi Scichart Team,
RenderableSeries Hit-Test still having some issues. I saw that the bug on your board is already closed state and my last comments are missed on the bug. So i am adding the same here.
https://www.scichart.com/questions/js/renderableseries-hit-test-not-working-as-expected
Can you please check the video and the code. Only change i have done on the Example is the data values are updated. On the video you can saw the clicking outside for some area Hit is showing, some area miss is showing, and clicking on the lines or point also showing the same. Let me know you need any more inputs from my side.
- Arun Surendran asked 3 years ago
- last active 2 years ago
Hello,
we plan to generate reports containing SciChart charts, so we can re-use the chart components we show in our web-application. We did the same successfully in the past with SciChart for WPF.
So far I didn’t find any special support to generate high quality print output (and printing for js charts in general). Using the web-browsers print function the charts are rendered as bitmaps at screen resolution. In SciChart for WPF you provide a Vector Rendering Plugin which we used for printing (as described here https://support.scichart.com/index.php?/Knowledgebase/Article/View/17263/40).
Is there already support for high quality rendering in SciChart.js or do you have plans for it and maybe a timeline when to expect it?
I found one issue when printing from the example charts (https://demo.scichart.com/javascript-line-chart). After opening with a new browser window, on the first print the page content in the print dialog is most times empty but after reloading (F5) it is apparently always shown. I don’t know yet if this would be an issue when rendering to a PDF which we plan, but I think this should always work at the first time a page is loaded. Tested with current Chrome (88.0.4324.104) and Edge (88.0.705.56).
I wanted to attach a .png screenshot (435 KiB) but it didn’t work (a progress bar runs to 100% but then the file list is still empty tried file selection and drag&drop ). I think the issue should be understandable without a screenshot?
Update
I could add the image using the edit function.
Greetings,
Nils
- Nils Beckmann asked 3 years ago
- last active 3 years ago
I am wondering if there may be some guidance on how to configure the styles for the SciChart.js chart instance in a React application to be able to handle dynamic changes to the height value.
The scenario is that the chart and wasm context are being saved in refs, so that the component the chart exists within does not rerender. Data is being consumed via a web socket, and streaming realtime data.
All that is well and good, but trying to implement a new feature request where the height of the chart changes dynamically, similar to an accordion style where the chart may have a full view, a split view, or no view (92vh, 46vh, 0vh)
I am finding that my css styles are not applying, or frustratingly will apply seemingly at random and other times not apply even though the underlying code remains the same. I tried to override, or at least alter, the position absolute styles of the canvas, by wrapping it in a parent element with position relative, which works to keep the height and width of the chart as desired, but the aspect ratio seems to falter and the chart axes are blurred and illegible.
I’m sure this would be a great instance of a picture says a 1000 words, and I am nearing a 1000 words. Will try to attach a codepen/ example that demonstrates the issue I am experiencing.
If there are any tips or tricks you would recommend please advise
- James Miller asked 3 years ago
- last active 3 years ago
Hello! Can you help me with creating footprint chart. In documentation and examples I didn`t find way how to do that. How can I create it ?
- test11111 123 asked 3 years ago
- last active 2 years ago
I would like to change the backgound color of my piechart.
const sciChartPieSurface = await SciChartPieSurface.create(props.chartName);
sciChartPieSurface.applyTheme(new SciChartJSLightTheme());
This code above doesnt change anything.
- Medina Blake asked 3 years ago
- last active 3 years ago
If the y axis values are same then the lines are not visible on the chart and the labels are also not visible on the chart. Can you draw the lines on the middle of the chart to get more visible?
async initTrack() {
  const { wasmContext, sciChartSurface } = await SciChartSurface.create(
    "chart" + this.element
  );
  sciChartSurface.xAxes.add(
    new NumericAxis(wasmContext, { axisAlignment: EAxisAlignment.Top })
  );
  sciChartSurface.yAxes.add(
    new NumericAxis(wasmContext, {
      axisAlignment: EAxisAlignment.Left
    })
  );

  const dataSeries = new XyDataSeries(wasmContext);
  for (let i = 0; i <= 1000; i++) {
    dataSeries.append(i, 10);
  }

  const rendSeries = new FastLineRenderableSeries(wasmContext, {
    dataSeries: dataSeries,
    strokeThickness: 1,
    stroke: "red"
  });
  sciChartSurface.renderableSeries.add(rendSeries);
  sciChartSurface.chartModifiers.add(cursorModifier);

  return { wasmContext, sciChartSurface };
}
- Arun Surendran asked 3 years ago
- last active 3 years ago
I am getting the alert message on our application and now I got the same message on the https://demo.scichart.com/javascript-line-chart also. It’s not happening all the time. But it’s happening sometimes only on the application.
- Arun Surendran asked 3 years ago
- last active 3 years ago
Hi there,
I got a error message, please tell me what’s wrong about my code ?
Please check the image, thank
Best Regards.
Yen Wen
- YEN-WEN WANG asked 3 years ago
- last active 3 years ago
How to setup SciChart.js in React native frame work?
- Subin Raj asked 2 years ago
- last active 10 months ago
Hi,
On RubberBandXyZoomModifier i am using the YDirection zoom. When i click and drag out side the area of sci chart and leave the mouse click. Then again click inside the scichart, it showing the selection area and not disappear after new selection of zoom or pan the chart. the selected area is still showing as selected.
- Arun Surendran asked 3 years ago
A client responded that the line diagram drawn by scient.js on the mobile phone could not be seen.
We follow the user’s log and find that there is such content
2022/09/21 07:02:27.981 exception thrown: RuntimeError: function signature mismatch,RuntimeError: function signature mismatch
            at <anonymous>:wasm-function[2101]:0x5fc72
            at <anonymous>:wasm-function[1355]:0x2a029
            at <anonymous>:wasm-function[2409]:0x7ef3a
            at Ch (<anonymous>:wasm-function[4028]:0x12f27f)
            at r._main (<anonymous>:16:687711)
            at Object.Ma [as callMain] (<anonymous>:16:688823)
            at <anonymous>:16:565075

2022/09/21 07:02:27.981 Could not load SciChart WebAssembly module.
            Check your build process and ensure that your scichart2d.wasm, scichart2d.data and scichart2d.js files are from the same version
.
We try to reproduce many different devices. At present, it seems that only the device will happen. The following is the information of the device
- chinghung lai asked 2 years ago
- last active 1 year ago
It’s impossible to zoom a candlestick chart (other types as well) on mobile browsers & WebViews.
I’m trying to use pinch-to-zoom with my fingers on chart, but it doesn’t react on it. Only sliding on the left & right is possible.
I’ve even tried demo from documentation:
https://demo.scichart.com/javascript-realtime-ticking-stock-charts
The same is with my chart as well
How can I fix it?
Thank you
- Roman Zio asked 3 years ago
- last active 3 years ago
Hello,
I am attempting to get SciChart working in a Blazor Server app.
I have followed the examples here:
https://github.com/ABTSoftware/SciChart.JS.Examples/tree/master/Sandbox/demo-browser-global-module
https://github.com/ABTSoftware/SciChart.JS.Examples/blob/master/Tutorials/2D_Browser_CDN_Tutorials_JavaScript/Tutorial_2_Adding_Series_and_data/index.html
https://www.scichart.com/documentation/js/current/webframe.html#Deploying%20Wasm%20or%20WebAssembly%20and%20Data%20Files%20with%20your%20app.html
https://cdn.jsdelivr.net/npm/[email protected]/README.md
I have the following line in my “_Layout.cshtml” file in the head section:
<script src="https://cdn.jsdelivr.net/npm/[email protected]/_wasm/scichart.browser.js" crossorigin="anonymous"></script>
In my scichart js I have:
export async function initSciChart() {
    SciChart.SciChartSurface.setRuntimeLicenseKey("....");
    SciChart.SciChartSurface.useWasmFromCDN();
}
However when I call this over JSInterop i get the following error:
Error: Microsoft.JSInterop.JSException: SciChart.SciChartSurface.useWasmFromCDN is not a function
TypeError: SciChart.SciChartSurface.useWasmFromCDN is not a function
at Module.initSciChart (https://localhost:7195/Pages/Strategy/StrategyMain.razor.js:33:30)
at https://localhost:7195/_framework/blazor.server.js:1:3501
at new Promise ()
at kt.beginInvokeJSFromDotNet (https://localhost:7195/_framework/blazor.server.js:1:3475)
at https://localhost:7195/_framework/blazor.server.js:1:72001
at Array.forEach ()
at kt._invokeClientMethod (https://localhost:7195/_framework/blazor.server.js:1:71987)
at kt._processIncomingData (https://localhost:7195/_framework/blazor.server.js:1:70029)
at connection.onreceive (https://localhost:7195/_framework/blazor.server.js:1:64432)
at o.onmessage (https://localhost:7195/_framework/blazor.server.js:1:48766)
at Microsoft.JSInterop.JSRuntime.InvokeAsync[TValue](Int64 targetInstanceId, String identifier, Object[] args)
at Microsoft.JSInterop.JSObjectReferenceExtensions.InvokeVoidAsync(IJSObjectReference jsObjectReference, String identifier, Object[] args)
at TradeLogicBS.Web.Pages.Strategy.StrategyMain.OnAfterRenderAsync(Boolean firstRender) in D:\Repos\TradeLogicBS\TradeLogicBS\TradeLogicBS.Web\Pages\Strategy\StrategyMain.razor:line 63
at Microsoft.AspNetCore.Components.RenderTree.Renderer.GetErrorHandledTask(Task taskToHandle, ComponentState owningComponentState)
How do we set this up properly to access the scichart modules in a blazor server application?
Thank you,
- Leland asked 2 years ago
- last active 2 years ago
I was used fifo(scrolling) chart in wpf scichart.
But.
I could not found fifo option in js scichart.
Maybe because there is no fifo option, if there is a lot of data accumulated, the chart is slow and cannot be used.
Can I use fifo(scrolling) chart in js scichart?
- 동윤 이 asked 3 years ago
- last active 3 years ago
Hi,
We found that the part of our project that uses scichart does not work correctly on iOS12, and then we tried to open a browser on iOS12 to the scichart javascript demo webpage, and found that it did not work.
What is the minimum iOS version supported by javscript scichart?
- chinghung lai asked 2 years ago
- last active 5 months ago
Hello!
What do these warnings mean to me? Do I need to react to them somehow? Maybe they are not always shown, but, for example, in developer mode?
- Roman Gavrilow asked 3 years ago
- last active 3 years ago
Hi,
we have recently bought Bundle licenses to be able to use SciChart JS. We are non-profit and make in-house web-applications.
I want to migrate to it asap but need urgent clarification on the licensing. There is only 1 domain allowed per developer. This seems strange to me because we run multiple micro-UIs under different domains. We also have dev & test environments. Do we need an extra license for all of these?
Please clarify. We are very happy with SciChart but this would be a major problem for us.
- Stephan Bertl asked 4 years ago
- last active 3 years ago
