Hi, I’m looking for some pointers on how to implement the following:
- User draws a selection on the chart (similar to rubber band modifier)
- Annotation is drawn on the chart conforming to the users selection
- Annotation is fixed relative to the data point (e.g. will scroll is the chart is panned etc)
Many thanks
- Henrique Rodrigues asked 3 years ago
- last active 2 years ago
Hi, I wanted to make a multiple Y-Axis scale with multiple series plot into their respective Y scale. Like this,
Series A plot to 1st Y-axis Scale
Series B plot to 2nd Y-axis Scale
Series C plot to 3rd Y-axis Scale
Series D plot to 4th Y-axis Scale
and all those series are not overlapping each other. I want to do like the picture attached but with the series are not overlapping to each other.
- syahiran keysight asked 3 years ago
- last active 3 years ago
When I’m viewing a chart from mobile browser, quality of graphics is very low.
I can see pixels and some blurred graphics on mobile browsers. But it’s completely ok on the desktop browsers.
I reproduced it with an official example:
https://demo.scichart.com/javascript-realtime-ticking-stock-charts
- Roman Zio asked 3 years ago
- last active 1 year ago
Hi,
Our website is running on a web hosting service supported by the university. To work with the SciChart JS, do we have to install the npm and configure it accordingly? If so, we probably have to contact IT department for assistance, since we don’t have permission to do so.
Please advise. Thanks.
- Gang Xu asked 3 years ago
- last active 9 months ago
Hi Andrew:
It’s me again.
Does SciChart.js support Vue.js 2.0 or even 3.0 ?
Will there be any Vue templates in the future ?
Best Regards
Yen Wen
- YEN-WEN WANG asked 4 years ago
- last active 3 years ago
I am having problem instantiating SciChart.js within a specific project and was hoping you might be able to help. To provide context I can run SciChart fine in simple projects and I suspect that I have a webpack issue.
When running a simple graph instantiation such as –
import React, { useEffect } from "react";
import ReactDOM from "react-dom";
import { SciChartSurface } from "scichart/Charting/Visuals/SciChartSurface";
import { NumericAxis } from "scichart/Charting/Visuals/Axis/NumericAxis";

export function MipsGraph(props) {
    useEffect(() => {
        initSciChart();
    });

    return (
        <div id="depthGraph" style={{height: "100%"}} ></div>
    );
}

async function initSciChart() {
    const { sciChartSurface, wasmContext } = await SciChartSurface.create("depthGraph");

    const xAxis = new NumericAxis(wasmContext);
    const yAxis = new NumericAxis(wasmContext);

    sciChartSurface.xAxes.add(xAxis);
    sciChartSurface.yAxes.add(yAxis);
}
I see the following error
Uncaught (in promise) RuntimeError: abort(TypeError:
WebAssembly.instantiate(): Import #0 module=”env” error: module is not
an object or function). Build with -s ASSERTIONS=1 for more info.
and the warning –
wasm streaming compile failed: TypeError: WebAssembly.instantiate():
Import #0 module=”env” error: module is not an object or function
The warning is raised at line 7544 (after pretty print in chrome dev tools) of scichart2d.js?formatted at a line calling WebAssembly.instantiateStreaming(e,d). both e and d have values.
Debugging originally led me to believe that there was an issue finding the scichart2d.wasm file however network traffic clearly shows the file being fetched.
Any ideas?
- Paul Hodgson asked 3 years ago
- last active 3 years ago
Hello,
It’s possible to change the data point instead of a line, put a circle or other something else?
You can check out what I need to change on image below.
Many thanks,
Pedro Cruz
- Ricardo Diz asked 3 years ago
- last active 3 years ago
Hello
My application environment is on the mobile browser, so we need to switch between [pan] and [rollover]
When I use a button to switch, everything is fine, but when I want to switch with a long press, an exception occurs
Below is my code
    initModifier() {
        this.partitionList.forEach((obj, idx)=>{
            let sciChartSurface = this.sciObj[idx].sciChartSurface;
            this.zoomPanModifier[idx] = new ZoomPanModifier();
            this.rolloverModifier[idx] = new RolloverModifier({modifierGroup: this.modifierGroupId, showTooltip: false});
            this.zoomPanModifier[idx].isEnabled = true;
            // 擴增功能
            sciChartSurface.chartModifiers.add(
                this.zoomPanModifier[idx],
                new ZoomExtentsModifier(),
                new MouseWheelZoomModifier(),
                new PinchZoomModifier(),
            );
        });
    },
    switchCross() {
        let enablePan = !this.zoomPanModifier[0].isEnabled;
        this.partitionList.forEach((obj, idx)=>{
            let sciChartSurface = this.sciObj[idx].sciChartSurface;
            this.zoomPanModifier[idx].isEnabled = enablePan;
            if (enablePan)
                sciChartSurface.chartModifiers.removeAt(4);
            else
                sciChartSurface.chartModifiers.add(this.rolloverModifier[idx]);
        });
    },
I recorded a video, first use the button to switch, and then long press to switch, you can see the problem I want to narrate from the video, the URL is as follows: https://youtu.be/vJjbLNGS-iM
After the problem occurred, it was expected that touchmove should be [pan], but it became [zoom]
Thanks for your help
- chinghung lai asked 2 years ago
- last active 2 years ago
We are having the first experiences with SCIchart. Could someone help with this problem we are experiencing?
[ encore ] ERROR Failed to compile with 1 errors14:42:33 [ encore ]
Module build failed: Module not found: [ encore ]
“./node_modules/scichart/_wasm/scichart2d.wasm” contains a reference
to the file “a”. This file can not be found, please check it for typos
or update it if the file got moved. [ encore ] ERROR in
./resources/js/Pages/Home.vue?vue&type=template&id=6a63e488&scoped=true&ts=true
(./node_modules/unplugin/dist/webpack/loaders/transform.js?unpluginName=unplugin-vue-components!./node_modules/vue-loader/dist/templateLoader.js??ruleSet[1].rules[3]!./node_modules/vue-loader/dist/index.js??ruleSet[0].use[0]!./resources/js/Pages/Home.vue?vue&type=template&id=6a63e488&scoped=true&ts=true)
10:27 Module parse failed: Unexpected token (10:27) File was processed
with these loaders: *
./node_modules/unplugin/dist/webpack/loaders/transform.js *
./node_modules/unplugin/dist/webpack/loaders/transform.js *
./node_modules/vue-loader/dist/templateLoader.js *
./node_modules/vue-loader/dist/index.js You may need an additional
loader to handle the result of these loaders. | }, null, -1 /* HOISTED
*/)) |export function render(_ctx: any,_cache: any,$props: any,$setup: any,$data: any,$options: any) { | return (_openBlock(),
_createElementBlock(“div”, _hoisted_1, [ | _createElementVNode(“h1”, null, _toDisplayString(_ctx.msg), 1 /* TEXT */),ERROR in ./node_modules/scichart/_wasm/scichart2d.wasm Module not
found: Error: Can’t resolve ‘a’ in
‘C:\Users\clo\fr\Projeto\chart\App\node_modules\scichart_wasm’ERROR in ./node_modules/scichart/_wasm/scichart3d.wasm Module not
found: Error: Can’t resolve ‘a’ in
‘C:\Users\clo\fr\Projeto\chart\App\node_modules\scichart_wasm’webpack compiled with 3 errors
- Marcelo Wanderley asked 1 year ago
- last active 5 months ago
Hello Scichart Team again,
I’m trying to replicate anything like this (check Screenshot_2.png).
I can update the scichart background, but I just wanted to have a single color in the background, but it seems that there is an overlap of colors in X / Y as I show in the next printscreen (check Screenshot_3.png)
How I can solve this?
Waiting for feedback.
Many thanks,
Pedro Cruz
- Ricardo Diz asked 3 years ago
- last active 3 years ago
I am getting an error trying to initialize chart inside the shadow root element:
sciChartInitCommon.js:224 Chart div element with the ID "my-unique-chart-id is not present in the DOM
or
sciChartInitCommon.js:43 Uncaught (in promise) Error: Check div element with id "my-unique-chart-id" exists
Is there overrides for SciChartSurface.create method to pass target html node instead of it`s ID? Or maybe I have missed any other built-in way to use SC inside shadow DOM? Thanks for the advise.
- Sergey Chernyakov asked 2 years ago
- last active 2 years ago
I wanted to use a stepline-box chart in my javascript applications for ELD, I failed to find out a similar box graph in the javascript chart section. The graph I have really looking for is attached here.
Could anyone please help me out?
- tomin thomas asked 3 years ago
- last active 3 years ago
- SciChartSurface created with category x and numeric y axes
- ZoomPanModifier, ZoomExtentsModifier, MouseWheelZoomModifier, RolloverModifier added.
- Any series and dataSeries are initialized and added to the surface, but not filled with values yet.
- Value streaming started with delay.
The first error occurs when trying to zoom on empty surface :
Uncaught TypeError: Cannot read properties of undefined (reading 'width')
at MouseWheelZoomModifier2.ChartModifierBase2D2.growBy (ChartModifierBase2D.js:121:48)
And the other one when trying to drag:
Uncaught Error: category x axis with id=DefaultAxisId should have data series count > 0
at CategoryAxis2.CategoryAxisBase2.getCurrentCoordinateCalculatorInternal (CategoryAxisBase.js:95:19)
I have seen errors similar to the second one in other scenarios and sometimes it is fatal.
E.g i have tried to add annotation right after first value was added and first line raised similar error:
    const xCalc = this.surface.xAxes.get(0).getCurrentCoordinateCalculator() as CategoryCoordinateCalculator;
    const realX = xCalc.transformDataToIndex(time);
    const target = this.getOrAddAnnotation();
    target.x1 = realX;
    target.y1 = value;
Also getCurrentCoordinateCalculatorInternal error occurs when empty series & seriesData added without suspend.
I would appreciate any help and clarification
- Sergey Chernyakov asked 2 years ago
- last active 2 years ago
I encountered an exception inside scichart2d.js when I used hitTestProvider.hitTest.
getHitTestInfo(idx, e) {
let touch0 = e.targetTouches[0];
let rect = e.currentTarget.getBoundingClientRect();
let x = parseInt(touch0.pageX - rect.left);
let y = parseInt(touch0.pageY - rect.top);
const premultipliedX = x * DpiHelper.PIXEL_RATIO;
const premultipliedY = y * DpiHelper.PIXEL_RATIO;
let lineSeries = this.$store.state.components.scitchart.sciObj[idx].sciChartSurface.renderableSeries.items[0];
console.log(`lineSeries.hitTestProvider.hitTest(${premultipliedX}, ${premultipliedY}, ${DpiHelper.PIXEL_RATIO})`);
let result = lineSeries.hitTestProvider.hitTest(premultipliedX, premultipliedY, DpiHelper.PIXEL_RATIO);
return result;
}
The video URL is as follows
https://youtu.be/3GIlv_ldorY
- chinghung lai asked 2 years ago
- last active 2 years ago
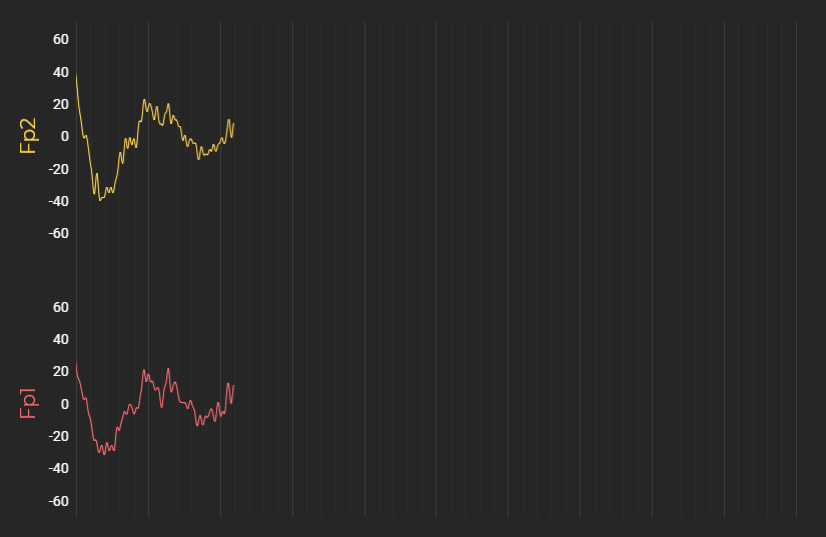
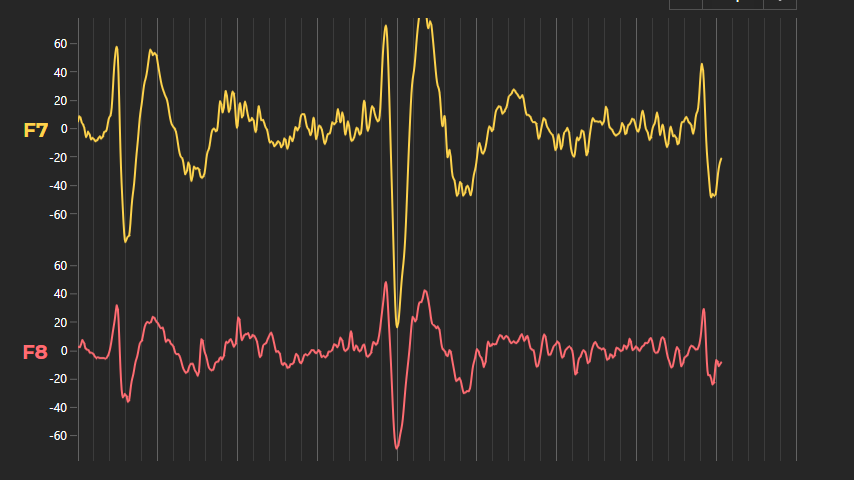
How can I rotate the axis titles in SciChat JS?
We want the the titles Fp1 and Fp2 to be rotated so they are horizontal on the screen instead of vertical.
- Tim Stephansen asked 2 years ago
- last active 2 years ago
I am getting a console error when using isVisible: false to the FastLineRenderableSeries or FastMountainRenderableSeries and CursorModifier together.
  const { wasmContext, sciChartSurface } = await SciChartSurface.create(
    "chart" + this.element
  );
  sciChartSurface.xAxes.add(
    new NumericAxis(wasmContext, { axisAlignment: EAxisAlignment.Top })
  );
  sciChartSurface.yAxes.add(
    new NumericAxis(wasmContext, {
      axisAlignment: EAxisAlignment.Left,
      growBy: new NumberRange(0.4, 0.4)
    })
  );

  const dataSeries = new XyDataSeries(wasmContext);
  const POINTS = 1000;
  const STEP = (3 * Math.PI) / POINTS;
  for (let i = 0; i <= 1000; i++) {
    const k = 1 - i / 2000;
    dataSeries.append(i, Math.sin(i * STEP) * k * 0.7);
  }

  const rendSeries = new FastLineRenderableSeries(wasmContext, {
    dataSeries: dataSeries,
    strokeThickness: 1,
    stroke: "red",
    isVisible: false
  });
  sciChartSurface.renderableSeries.add(rendSeries);
  // sciChartSurface.background = this.color;

  sciChartSurface.chartModifiers.add(
    new ZoomExtentsModifier(),
    new ZoomPanModifier(),
    new MouseWheelZoomModifier()
  );

  // Add CursorModifier behavior
  const cursorModifier = new CursorModifier({
    crosshairStroke: "#ff6600",
    crosshairStrokeThickness: 1,
    tooltipContainerBackground: "#000",
    tooltipTextStroke: "#ff6600",
    showTooltip: true,
    axisLabelsFill: "#b36200",
    axisLabelsStroke: "#fff"
  });
  sciChartSurface.chartModifiers.add(cursorModifier);

  sciChartSurface.zoomExtents();
  return { wasmContext, sciChartSurface };
- Arun Surendran asked 3 years ago
- last active 3 years ago
I have been trying to integrate Scichart JS in my Ionic 5 (Capacitor) application, but didn’t get succeed on that. I really need help on that
- Subham Dandapat asked 3 years ago
- last active 3 years ago
I have a bunch of series (XyScatterSeries) that I am using to draw different markers (triangle, circle, cross) based on the data. I also have couple line series too in the chart.
The line series should be displayed in the LegendModifier, but not any of the scatter series.
I tried setting “includeSeries” function here but that didn’t work (typescript kept complaining about it but I kept it and while running the app it didn’t hide the series):
return new LegendModifier({
        showCheckboxes: true,
        orientation: ELegendOrientation.Vertical,
        placement: ELegendPlacement.TopRight,
        includeSeries: (series: IRenderableSeries, isIncluded: boolean): void => { return false; },
    });
Then I created my own class “MyLegendModifier” deriving from LegendModifier, but that didn’t do anything either.
class MyLegendModifier extends LegendModifier {
    constructor(options?: ILegendModifierOptions) {
        super(options);
    }

    includeSeries(series: IRenderableSeries, isIncluded: boolean) {
        console.log('includeSeries:', series.id);
        if (series.id.startsWith('BUY:') || series.id.startsWith('SELL:')) {
            isIncluded = false;
        }
        super.includeSeries(series, isIncluded);
    }
}
Any advise please.
- sachin patel asked 2 years ago
- last active 2 years ago
Hello, I’d like to know how is possible to draw Axis Bands from one data point to another.
I’m currently creating real-time stock charts and I need to display the after-hours with a different band.
Thanks in advanced for your help,
- Eliezer Veras asked 2 years ago
- last active 2 years ago
Hi,
I have an issue with Rollover modifier line styling in sci chart using java script. we need the horizontal dashed line for the rollover modifier. How is it possible?
- Ayana VS asked 2 years ago
- last active 2 years ago
I would like to create an arc annotation as shown in the attached image in Scichart JavaScript.
Please guide me on what will be the best way.
- Ramesh Sippy asked 2 years ago
- last active 2 years ago
Hi,
Unsorted xValues is possible on SCI Chart? I tried with dataIsSortedInX: false and isSorted: false on dataSeries, But its not showing the correct range.
eg:
 new XyDataSeries(wasmContext, {
        dataSeriesName: "Line Series",
        xValues: [0,10,20,13,54,15,26,17,18,19],
        yValues: [0,1,5,1,20,5,1,8,9,3],
    dataIsSortedInX: false
    });
- Arun Surendran asked 3 years ago
- last active 3 years ago
Hi, Custom tooltip is not working on v2.0.2179.
Its working on v2.0.2146. Can you please check the issue..
import { SciChartSurface } from "scichart/Charting/Visuals/SciChartSurface";
import { NumericAxis } from "scichart/Charting/Visuals/Axis/NumericAxis";
import { XyDataSeries } from "scichart/Charting/Model/XyDataSeries";
import { FastLineRenderableSeries } from "scichart/Charting/Visuals/RenderableSeries/FastLineRenderableSeries";
import { RangeSelectionChartModifier } from "./RangeSelectionChartModifier";
import { RubberBandXyZoomModifier } from "scichart/Charting/ChartModifiers/RubberBandXyZoomModifier";
import { MouseWheelZoomModifier } from "scichart/Charting/ChartModifiers/MouseWheelZoomModifier";
import { EXyDirection } from "scichart/types/XyDirection";
import { ZoomExtentsModifier } from "scichart/Charting/ChartModifiers/ZoomExtentsModifier";
import { EClipMode } from "scichart/Charting/Visuals/Axis/AxisBase2D";
import { MouseButtonZoomChartModifier } from "./MouseButtonZoomChartModifier";
import { SeriesInfo } from "scichart/Charting/Model/ChartData/SeriesInfo";
import { CursorTooltipSvgAnnotation } from "scichart/Charting/Visuals/Annotations/CursorTooltipSvgAnnotation";
import { CursorModifier } from "scichart/Charting/ChartModifiers/CursorModifier";


async function initSciChart() {
    const { sciChartSurface, wasmContext } = await SciChartSurface.create("scichart-root");

      const xAxis = new NumericAxis(wasmContext);
      const yAxis = new NumericAxis(wasmContext);

      sciChartSurface.xAxes.add(xAxis);
      sciChartSurface.yAxes.add(yAxis);

      const xyData = new XyDataSeries(wasmContext);
      for (let i = 0; i < 250; i++) {
        xyData.append(i, Math.sin(i * 0.1));
      }
      sciChartSurface.renderableSeries.add(
        new FastLineRenderableSeries(wasmContext, { dataSeries: xyData })
      );

      const cursorModifier = new CursorModifier({
        crosshairStrokeThickness: 1,
        showTooltip: true,
        showAxisLabels: false,
        crosshairStroke: "transparent",
      });
      cursorModifier.tooltipSvgTemplate = (seriesInfo, svgAnnotation) => {
        let rowString = "";
        seriesInfo.forEach(() => {
          rowString = rowString + `<tspan x="8" dy="1.2em" fill="red">Test : 123</tspan>`;
        });

        const string = `<svg width="300" height="33" x="0"><defs>
            <filter id="id_1610011455082" x="0" y="0" width="200%" height="200%">
            <feOffset result="offOut" in="SourceAlpha" dx="3" dy="3"></feOffset>
            <feGaussianBlur result="blurOut" in="offOut" stdDeviation="3"></feGaussianBlur>
            <feBlend in="SourceGraphic" in2="blurOut" mode="normal"></feBlend>
            </filter>
            </defs>
            <rect rx="4" ry="4" width="95%" height="90%" style="stroke-width:1;stroke:'#ffffff'}"></rect>
            <svg width="100%"><text x="8" y="3" font-size="13" font-family="Verdana" dy="0">`;

        svgAnnotation.xCoordShift = 5;
        svgAnnotation.yCoordShift = 5;
        return string + rowString + `</text></svg></svg>`;
      };
      sciChartSurface.chartModifiers.add(
        cursorModifier
      );


      const mouseWheelModifier = new MouseWheelZoomModifier();
      mouseWheelModifier.modifierMouseWheel = args => {
        const delta = args.mouseWheelDelta * 0.1;
        mouseWheelModifier.parentSurface.xAxes.asArray().forEach(x => {
          x.scroll(delta, EClipMode.None);
        });
      };
      sciChartSurface.chartModifiers.add(
        new RubberBandXyZoomModifier({ xyDirection: EXyDirection.XDirection })
      );
      sciChartSurface.chartModifiers.add(mouseWheelModifier);
      sciChartSurface.chartModifiers.add(new ZoomExtentsModifier());
  }

   initSciChart();
- Arun Surendran asked 2 years ago
- last active 2 years ago
Hello,
I am currently developing an application using Electron (v. 8.3.0), React (v. 17.0.1), and TypeScript (v. 4.0.5). I have created a simple demo app (see attached) to test this software, and I found that whenever the application window is resized, there is an “Uncaught null” error from scichart2d.js caught by the console. I also found that at some window dimensions, it even seems that the chart cannot properly be displayed and it will try to constantly rerender, quickly filling up the console with the same error.
A couple of notes:
- I currently am using a trial key.
- I am compiling this application using electron-webpack (https://webpack.electron.build/). It has a few built-in tools that ease the compilation/app creation process when combining Electron with other frameworks. This means some of the webpack API being used is abstracted, but we can append our own (see webpack.renderer.additions.js), more information can also be found at https://webpack.electron.build/modifying-webpack-configurations.
- Electron v. 8.3.0 uses Chromium 80, so all features should be supported.
- Drew Afshari asked 3 years ago
- last active 3 years ago
I create custom annotation with nested input. In the code, I specify the autofocus property.
But autofocus only works once after page reload. With any manipulations with the chart (zoom, scrolling) – autofocus stops working.
Can you help me ?
- Taras Shevchenko asked 2 years ago
I am working on a proof of concept for our company to move some of our desktop apps to the web. We use SciChart WPF in our desktop apps so we are going with SciChart.JS for the web apps. Is it possible to stack the FastLineRenderableSeries in SciChart.JS like we do in WPF?
Edit: Found the answer just after I posted this question.
sciChartSurface.layoutManager.leftOuterAxesLayoutStrategy = new LeftAlignedOuterVerticallyStackedAxisLayoutStrategy();
- Tim Stephansen asked 2 years ago
- last active 6 months ago
Hi. Is it possible to implement a depth chart like in the screenshot using scichart?! depth chart
- alex korzh asked 1 year ago
- last active 1 year ago
Is there any way to provide annotation tooltip onmouseover? Perhaps I can subscribe on surface mouse events and manage visibility and positions on “tooltip” annotations by myself? If so, could you please provide reference to surface mouse events API.
- Sergey Chernyakov asked 2 years ago
- last active 4 months ago
Hi
I am trying out JS SciChart based on the Blazor example you have posted more than a year ago.
I cannot get the auto scaling to work by code (the default behavior does auto scale once right after adding the data). Calling sciChartSurface.zoomExtents(); (or zoomExtentsX() and zoomExtentsY() after one another) does zoom into a very details portion of the graph.
Also (maybe related) the tooltip does not update when moving the cursor around, it always keeps the same data. I tried using CursorModifier as well as RolloverModifier, both having the same problem.
Attached the JS code and the c# files and a picture how this looks like after calling the autoScale() method.
Thanks for any help
Regards
Reto
- Reto Stahel asked 2 years ago
- last active 2 years ago
I try to use this exemple on my PC with (nodejs 8.13.0) and i can’t run this app example. I receive this error:
× 「wds」: Invalid configuration object. Webpack has been initialized
using a configuration object that does not match the API schema.configuration.optimization has an unknown property ‘namedModules’.
These properties are valid:object { checkWasmTypes?, chunkIds?, concatenateModules?,
emitOnErrors?, flagIncludedChunks?, innerGraph?, mangleExports?,
mangleWasmImports?, mergeDuplicateChunks?, minimize?, minimizer?,
moduleIds?, noEmitOnErrors?, nodeEnv?, portableRecords?,
providedExports?, realContentHash?, removeAvailableModules?,
removeEmptyChunks?, runtimeChunk?, sideEffects?, splitChunks?,
usedExports? }-> Enables/Disables integrated optimizations. Did you mean optimization.moduleIds: “named” (BREAKING CHANGE since webpack 5)?*
Is there compatiblity problem with nodejs LTS version?
Thans for your response.
- Hochoc Max asked 1 year ago
- last active 1 year ago
I’ve been trying to implement the scichart js blazor wrapper in a serverside application. The chart starts to load, but gives the following error:
Failed to load resource: the server responded with a status of 404 () :5001/scichart2d.data:1
it looks like scichart2d.data is in the wrong place, but as far as I can tell it’s where it should be (in wwwroot).
is there something special I need to do in sever side? I can get it working fine in webAssembly Blazor
- Michael Hollas asked 3 years ago
- last active 2 years ago
I am considering applying server-side licensing for my javerScript application.
In the document below, there is a phrase “Our server-side licensing component is written in C++.”
(https://support-dev.scichart.com/index.php?/Knowledgebase/Article/View/17256/42/)
However, there is only asp.net sample code on the provided github.
(https://github.com/ABTSoftware/SciChart.JS.Examples/tree/master/Sandbox/demo-dotnet-server-licensing)
I wonder if there is a sample code implemented in C++ for server-side licensing.
Can you provide c++ sample code?
Also, are there any examples to run on Ubuntu?
- thier tom asked 1 year ago
- last active 1 year ago
We are using JavaScript Chart Editable Annotations but we need some more modificaions in that which can enhance this feature in terms of user experience.
Currently when the anonations are loaded they are havinng a fixed shape but we want the annotations to be draggable as soon as they are loaded in the charts whitout any extra clicks,this feature is provided by tradingView charts and we also want to provide the same to our users.
I have attached images and videos for better understanding of the issue.
Hope we can get the solution of this issue asap.
Please refer to the below video link for beter understanding.
https://www.loom.com/share/213b66eb21db44f9ac2457a89563a21a
- Saksham Jaiswal asked 1 year ago
- last active 1 year ago
I am implementing a heatmap. The data size of the heatmap would be changed. When the data size changed, I will replace the zValues of the UniformHeatmapDataSeries with an updated array. But it doesn’t work for me. The heatmap data cannot be plotted after I updated the zValues array. Below are my codes to create the heatmap and update the zValues array.
Draw heatmap:
    const { sciChartSurface, wasmContext } = await SciChartSurface.create("spectrogram-chart-root");
    let xAxisNumberRange = new NumberRange(minFreq/maxFreq);

    spectrogram_xAxis.current = new NumericAxis(wasmContext, {
        axisTitle: "Frequency",
        axisTitleStyle: {
            fontSize: CHART_STYLE.AXIS_FONT_SIZE,
            fontFamily: "sans-serif",
            fontWeight: "bold"
        },
        labelStyle: {
            fontSize: CHART_STYLE.LABEL_FONT_SIZE,
            fontFamily: "sans-serif"
        },
        visibleRange: xAxisNumberRange,
        visibleRangeLimit: xAxisNumberRange,
        zoomExtentsRange: xAxisNumberRange,
        labelFormat: ENumericFormat.Decimal,
        labelPrecision: 2,
        cursorLabelFormat: ENumericFormat.Decimal,
        cursorLabelPrecision: 2,
        drawMajorBands: false,
    });

    // Add XAxis and YAxis
    sciChartSurface.xAxes.add(spectrogram_xAxis.current);
    sciChartSurface.yAxes.add(new NumericAxis(wasmContext, { isVisible: false }));

    // Create a Heatmap Data-series. Pass heatValues as a number[][] to the UniformHeatmapDataSeries
    spectrogramZValues.current = Array.from(Array(SPECTROGRAM_HEIGHT), () => Array(SPECTROGRAM_WIDTH).fill(-200));
    heatmapDataSeries.current = new UniformHeatmapDataSeries(wasmContext, {
        xStart: 0,
        xStep: 1,
        yStart: 0,
        yStep: 1,
        zValues: spectrogramZValues.current
    });

    colorMap.current = new HeatmapColorMap({
        minimum: -200,
        maximum: -50,
        gradientStops: gradientStopsArr.current
    });

    // Create a Heatmap RenderableSeries with the color map. ColorMap.minimum/maximum defines the values in
    // HeatmapDataSeries which correspond to gradient stops at 0..1
    const heatmapSeries = new UniformHeatmapRenderableSeries(wasmContext, {
        dataSeries: heatmapDataSeries.current,
        useLinearTextureFiltering: true,
        isSorted: true,
        isEvenlySpaced: true,
        containsNaN: false,
        colorMap: colorMap.current
    });

    // Add heatmap to the chart
    sciChartSurface.renderableSeries.add(heatmapSeries);
Update heatmap data:
        // Update the chart x-axis
        if (xAxisUpdateRequired) {
            let xAxisNumberRange = new NumberRange(newStartFreq, newStopFreq);
            spectrogram_xAxis.current.visibleRange = xAxisNumberRange;
            spectrogram_xAxis.current.visibleRangeLimit = xAxisNumberRange;
            spectrogram_xAxis.current.zoomExtentsRange = xAxisNumberRange;

            // Reset the heatmap zValues
            heatmapDataSeries.current.clear();
            spectrogramZValues.current = Array.from(Array(SPECTROGRAM_HEIGHT), () => Array(newSampleSize).fill(-200));
            heatmapDataSeries.current.setZValues(spectrogramZValues.current);
        }
        // Update heatmap data
        spectrogramZValues.current.shift();
        spectrogramZValues.current.push(newSpecData);
        heatmapDataSeries.current.notifyDataChanged();
- Quyen Sy asked 1 year ago
- last active 1 year ago
I updated schichart to the very last version and turn on the memory usage debug mode to see if there are any memory leaks in our application and ran into the following problem.
When MemoryUsageHelper.isMemoryUsageDebugEnabled = true; and sciChartSurface has the following modifiers(RolloverModifier, CursorModifier) when moving the mouse over the chart I have the following console warnings.
From RolloverModifier instance

From CursorModifier instance

The message below is written on your docs about debugging, so I gues this is the case with the chart modifiers console warnings.
Usually this boils down to failing to call SciChartSurface.delete() (or series.delete(), annotation.delete() when adding/removing objects) or plain JavaScript memory leaks where references to SciChart are held in the customer application & not garbage collected by the browser.
Steps To Reproduce
- Follow the codesandbox example by the link https://codesandbox.io/s/ts-band-chart-xwlxcm?file=/src/App.tsx;
- Once the chart is loaded and rendered, try moving the mouse cursor over the chart;
- Open the browser console ⇒ You will see the warnings I wrote about above.
The current behavior
Moving the mouse over the chart causes warning logs to appear in the browser console and possibly memory leaks.
The expected behavior
No warning logs while moving the mouse over the chart.
- Sergey Chernyakov asked 8 months ago
- last active 8 months ago
Good afternoon. My team and I are looking at your library to create a depth chart, like here, but have run into a few problems:
1. if we have, for example, a “buySeries” array larger than the “sellSeries” array, the graph is not drawn very nicely.
2. the labels are not drawn correctly when we have too small numbers, I tried to solve the problem with xAxis.textFormatting = ‘0.#####’ or ‘0.00###’, but that doesn’t work for some reason.
3. If we want to add labels while hovering over the chart with showLabel = true , then we get 4 labels, two on yAxis. is it possible to make the buySeries label appear only on the left, for example, and the sellSeries label only on the right? (second screenshot)
- Andrew Smidth asked 1 year ago
- last active 1 year ago
Implementation scenario: multiple polylines are displayed. After clicking the polyline, the name of the polyline is displayed in the icon.
Question: I can get the Series Name through the SeriesSelectionModifier now, but I don’t know how to display the Series Name in the chart when the user clicks a polyline. Is there a corresponding API?
- js scichart asked 1 year ago
- last active 1 year ago
In our app we have a feature by which user can add indicators. These indicators can consist of 2 or a maximum of 4 lines.
We don’t want to render svg tooltips(which setted up by the default) with data for each line, instead of that we get point data and pass it to our app inner service that can render indicator legend.
To prevent default tooltips from being displayed we set for each renderable series of an indicator the following values.
rolloverModifierProps.width = 0; rolloverModifierProps.height = 0;
But of course tooltips are still rendered in the DOM and this leads to performance issues when we have 3 or more indicators of this type.
My question is the following
How we can render only circles svg for rollover modifier and completely dont render svg for tooltips in the DOM?
This is what the indicators look like
- Sergey Chernyakov asked 8 months ago
- last active 8 months ago
Is it possible to change the heatmap legend from vertical to horizontal?
- Quyen Sy asked 12 months ago
- last active 12 months ago
I have a live updating chart with multiple traces. After updated SciChart to v3.0.280, I got “Uncaught (in promise) RangeError: Maximum call stack size exceeded” error sometimes when I call XyDataSeries.appendRange(). This error will not be triggered if just initialize the chart and keeps updating the chart data. It seems happening after I modified the visibleRange of x-axis or y-axis. But the error is triggered on the line calling appendRange(). I have no clue for this issue. My codes didn’t change and only updated the SciChart version. Could you find the possible cause of my problem? Please refer to the attached screenshots.
Codes to update the chart data:
    UpdateSuspender.using(sciChartSurfaceRef.current, () => {
        console.time("Time - Update series");
        for (tnum=0; tnum<MAX_TRACE; tnum++) {
            traceObj = tracesInfoObj.current[tnum];
            if (traceSeries.current[tnum] && traceObj.status === "Active") {
                traceSeries.current[tnum]["xyDataSeries"].clear();
                switch (traceObj.type) {
                    case 0:
                        traceSeries.current[tnum]["xyDataSeries"].appendRange(dataX, newSpecData);
                        break;
                    case 1:
                        traceSeries.current[tnum]["xyDataSeries"].appendRange(dataX, newMaxHoldData);
                        break;
                    case 2:
                        traceSeries.current[tnum]["xyDataSeries"].appendRange(dataX, newMinHoldData);
                        break;
                    case 3:
                        traceSeries.current[tnum]["xyDataSeries"].appendRange(dataX, averageData);
                        break;
                }
            }
        };
        console.timeEnd("Time - Update series");
    });
- Quyen Sy asked 1 year ago
- last active 1 year ago
Hey, how would I go about adding a custom template for the cursor axis labels using the Javascript 2D chart API?
I’d like the x-axis to not just have a date in MM/DD/YYYY format but a date and time displayed. The current implementation is below, and below that is the desired implementation.
Current: https://ibb.co/qJgJ36j
Desired: https://ibb.co/XzTkDgw
I have looked through the documentation but I may have missed something. If I have, please point me in the right direction, thanks!
- NICOS TOMBROS asked 2 years ago
- last active 2 years ago
I am trying to build my application with Electron. When the Electron application is run, it will open the UI in the browser (not opened with chromium). I created two Electron applications with same codes but with different versions of SciChart (i.e. version 2 and version 3). When I run with the Electron application with SciChart v2, the SciChart can be loaded properly. When when I run the Electron application with SciChart v3, I got error (please refer to the screenshot) and the SciChart cannot be loaded. I am not sure what’s wrong. Do you have any idea?
- Quyen Sy asked 1 year ago
- last active 1 year ago
I am trying to add an axis annotation to a heatmap legend. When this annotation is dragged, the color mapping of the heatmap series and the heatmap legend will be changed. How can I modify the colorMap.gradientStops of the heatmap series and the heatmap legend while the chart is running?
- Quyen Sy asked 1 year ago
- last active 1 year ago
I am trying to implement the following functionality requested by our users:
Zoom:
– Only zoom the chart when using CTRL + MouseWheel key
– This is similar to how most browsers behave
Pan/Scroll:
– If no CTRL key is pressed, then pan/scroll
– This is similar to how most browsers behave
Given the above requirement, I started by creating custom modifier by extending YAxisDragModifier.
My code almost works:
– When using CTRL + Mouse Left & Drag, it Scales (zooms) — just like the user wants
– But using CTRL + Mouse Wheel does not do the same — it only Scales (Zooms).
I have uploaded the code at codesandbox.io:
https://codesandbox.io/s/amazing-shape-2ispt0?file=/src/customModifiers.ts
Note that I have not tried to implement this in ZoomPanModifier yet, but would be helpful if you could give me some pointers on getting this feature in there too.
I would appreciate any help I can get and thanks a bunch in advance.
Best Regards,
Sachin Patel.
- sachin patel asked 1 year ago
- last active 1 year ago
I have a big problem with memory, i try many things but it’s doesn’t effect.
It’s my code for testing memory :
    const { wasmContext, sciChartSurface } = await SciChartSurface.create("bandTest", { theme: new SciChartJSLightTheme() });
    sciChartSurface.title = "Axis 1";
    sciChartSurface.xAxes.add(new NumericAxis(wasmContext, { axisTitle: "Column number", axisTitleStyle: {fontSize: 12} }));
    sciChartSurface.yAxes.add(new NumericAxis(wasmContext, { axisAlignment: EAxisAlignment.Left, axisTitleStyle: {fontSize: 12} }));
    setTimeout(sciChartSurface.delete(),2000);
sciChartSurface.delete() have no effect for memory
I run snapshot without this code and another snapshot with this code. (snap 14 is before call SciChart and snap 15 is after call the code bellow)
What can I do?
Regards
- Marjorie lesage asked 10 months ago
- last active 9 months ago
I am considering applying server-side licensing for my javerScript application.
In the document below, there is a phrase “Our server-side licensing component is written in C++.”
(https://support.scichart.com/index.php?/Knowledgebase/Article/View/17256/42/)
However, there is only asp.net sample code on the provided github.
(https://github.com/ABTSoftware/SciChart.JS.Examples/tree/master/Sandbox/demo-dotnet-server-licensing)
I wonder if there is a sample code implemented in C++ for server-side licensing.
Can you provide c++ sample code?
Also, are there any examples to run on Ubuntu?
- eddy trouchaud asked 1 year ago
- last active 1 year ago
I have issues with the selection box of the textannotation in firefox.
Code for the annotation:
    return new TextAnnotation({
    id,
    text: text,
    verticalAnchorPoint: EVerticalAnchorPoint.Center,
    horizontalAnchorPoint: EHorizontalAnchorPoint.Left,
    xCoordinateMode: ECoordinateMode.DataValue,
    yCoordinateMode: ECoordinateMode.DataValue,
    x1: x1,
    y1: y1,
    fontSize: 16,
    fontWeight: "Bold",
    textColor: annotation.color,
    isEditable: isEditable,
    annotationLayer: EAnnotationLayer.AboveChart
})
Please see the differences in the images attached. In the Firefox browser it seems that the svg takes on the size of the scichart surface. Can you help me to fix this problem? The parameters selectionBoxDelta and selectionBoxThickness work in both browsers but do not fix the problem.
Thank you.
- Tobias Lettner asked 1 year ago
Hi,
Im working with Scichart JS on a React project and trying to write some tests using Jest.
I managed to start a browser environment with webgl support to run the tests, but I’m having a hard time to provide the .data and .wasm files to this environment.
This is what i’m trying to run:
import {SciChartSurface} from 'scichart/Charting/Visuals/SciChartSurface';

const buildSurface = async () => {
    const {sciChartSurface} = await SciChartSurface.create('test-surface', {
        viewportBorder: {border: 1}
    });
    return {sciChartSurface};
};

it('should build a surface', async () => {
    document.body.innerHTML = `<div id="test-surface"></div>`;
    const response = await buildSurface();
    const {sciChartSurface} = response;
});
and I’m getting lots of warns an errors like:
console.warn    both async and sync fetching of the wasm failed
console.error    Could not load SciChart WebAssembly module.
                    Check your build process and ensure that your scichart2d.wasm, scichart2d.data and scichart2d.js files are from the same version
console.error   Error: Uncaught [Error: NetworkError for: scichart2d.data]
thrown: "Could not load SciChart WebAssembly module.
                    Check your build process and ensure that your scichart2d.wasm, scichart2d.data and scichart2d.js files are from the same version"
Does anyone know how to setup a sufficient environment on jest to successfully build a scichart surface?
- Lucas Lucafó asked 1 year ago
- last active 1 year ago
Hello, I am using SciChartJS and have a new requirement from our users as follows that I need help with the implementation. Any pointers from anyone would be a great help.
**Requirements: **
- Assume that x-axis is Time and y-axis is prices.
- There are multiple series in the chart (e.g., Bid Price, Ask Price)
- Allow user to select a time on xAxis using
CTRL + CLICK - When the user selects the time, show the rollover line and the tooltip for all series at the selected time
- This rollover line and tooltip should remain visible until the user selects a new time on the x-axis at which point the rollover tooltip should display the tooltip for the new point.
I started inheriting the RolloverModifier but couldn’t find an appropriate method to show the tooltip.
So, I started implementing the above feature using CustomModifierBase2d and adding a VerticalLineAnnotation for the rollover line. But again, struggling with the tooltip.
If someone could help me out or give me pointers, that would be highly appreciated.
Best Regards,
Sachin Patel.
- sachin patel asked 9 months ago
- last active 8 months ago
I have a huge dataset to display in graphical form starting from the daily data for 30 days and then to each minute when zoom in, what is the best way to plot this data using zoom in functionality
- Umer Nawaz asked 1 year ago
- last active 1 year ago
