Pre loader
Try wave

macOS & iOS Chart Library

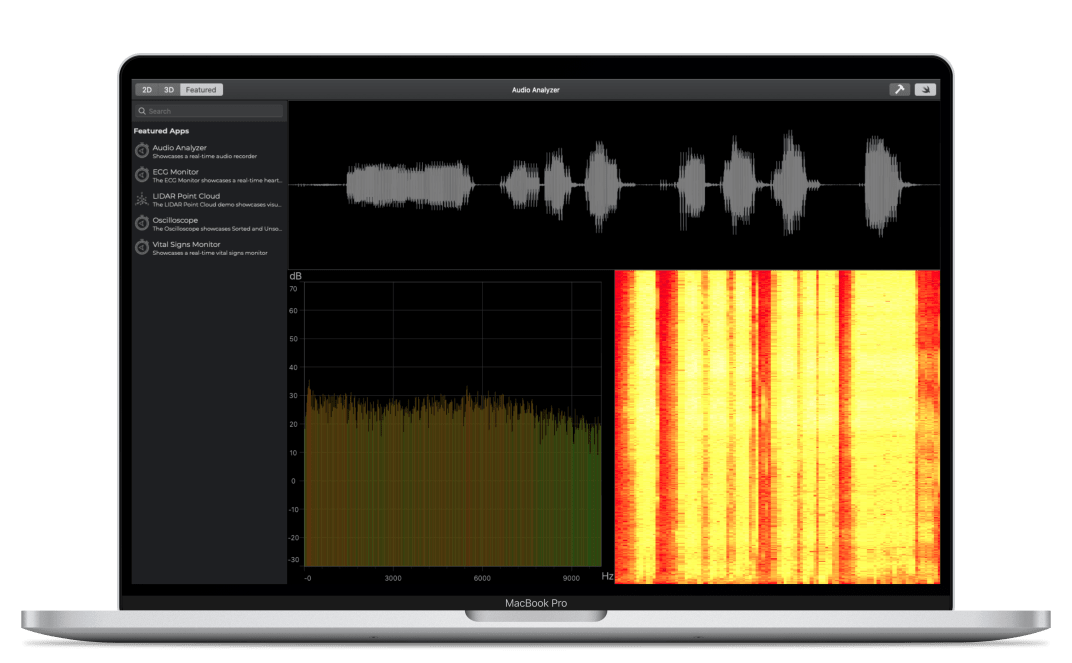
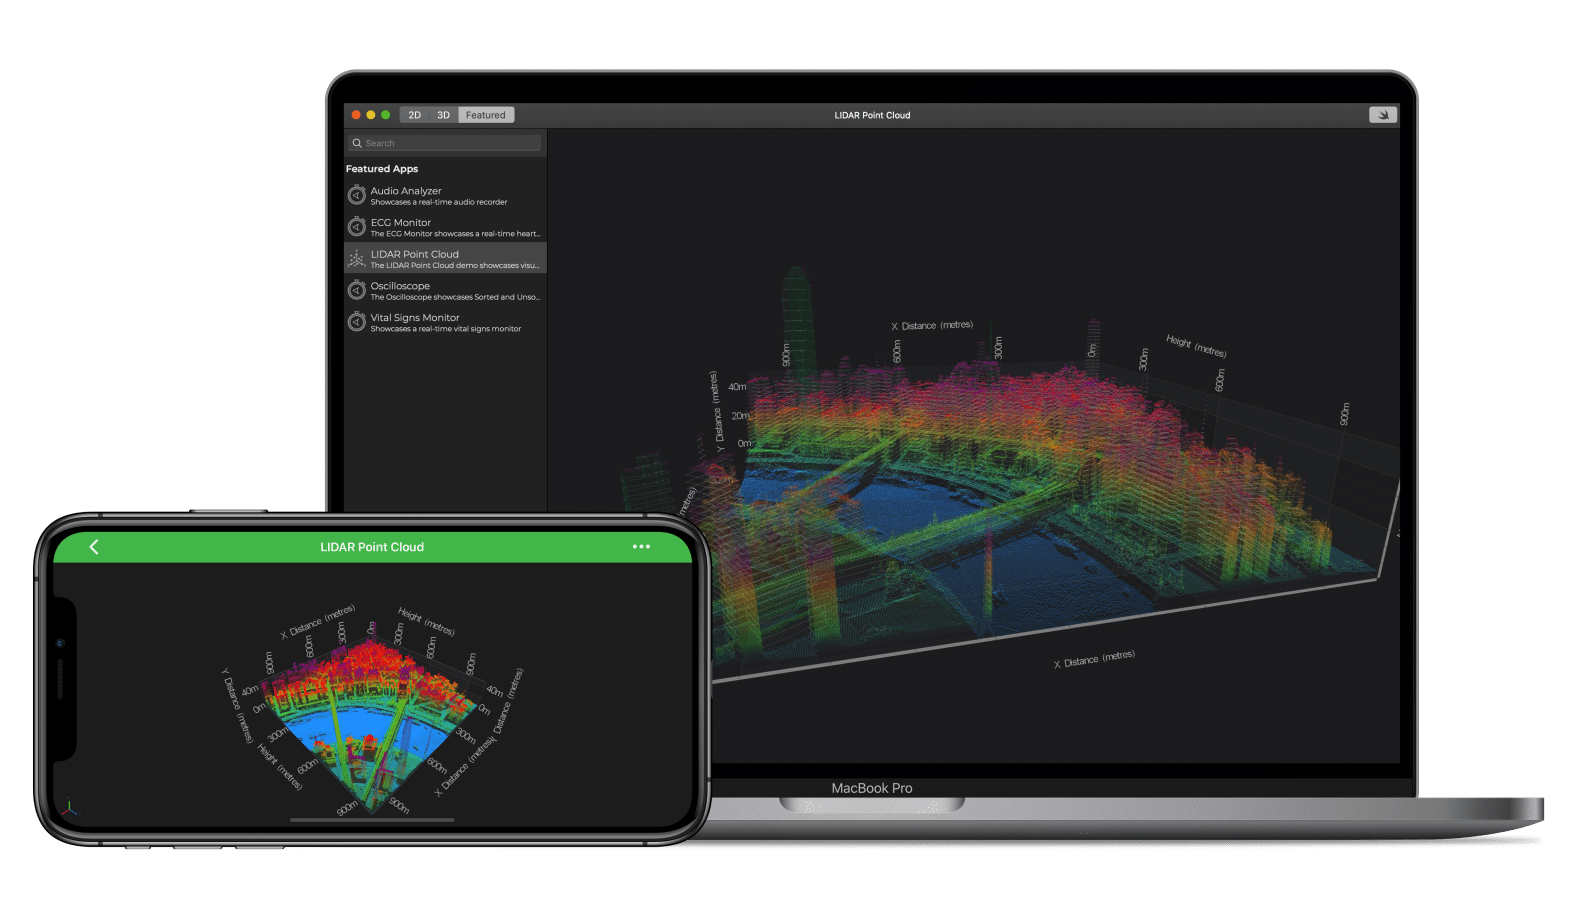
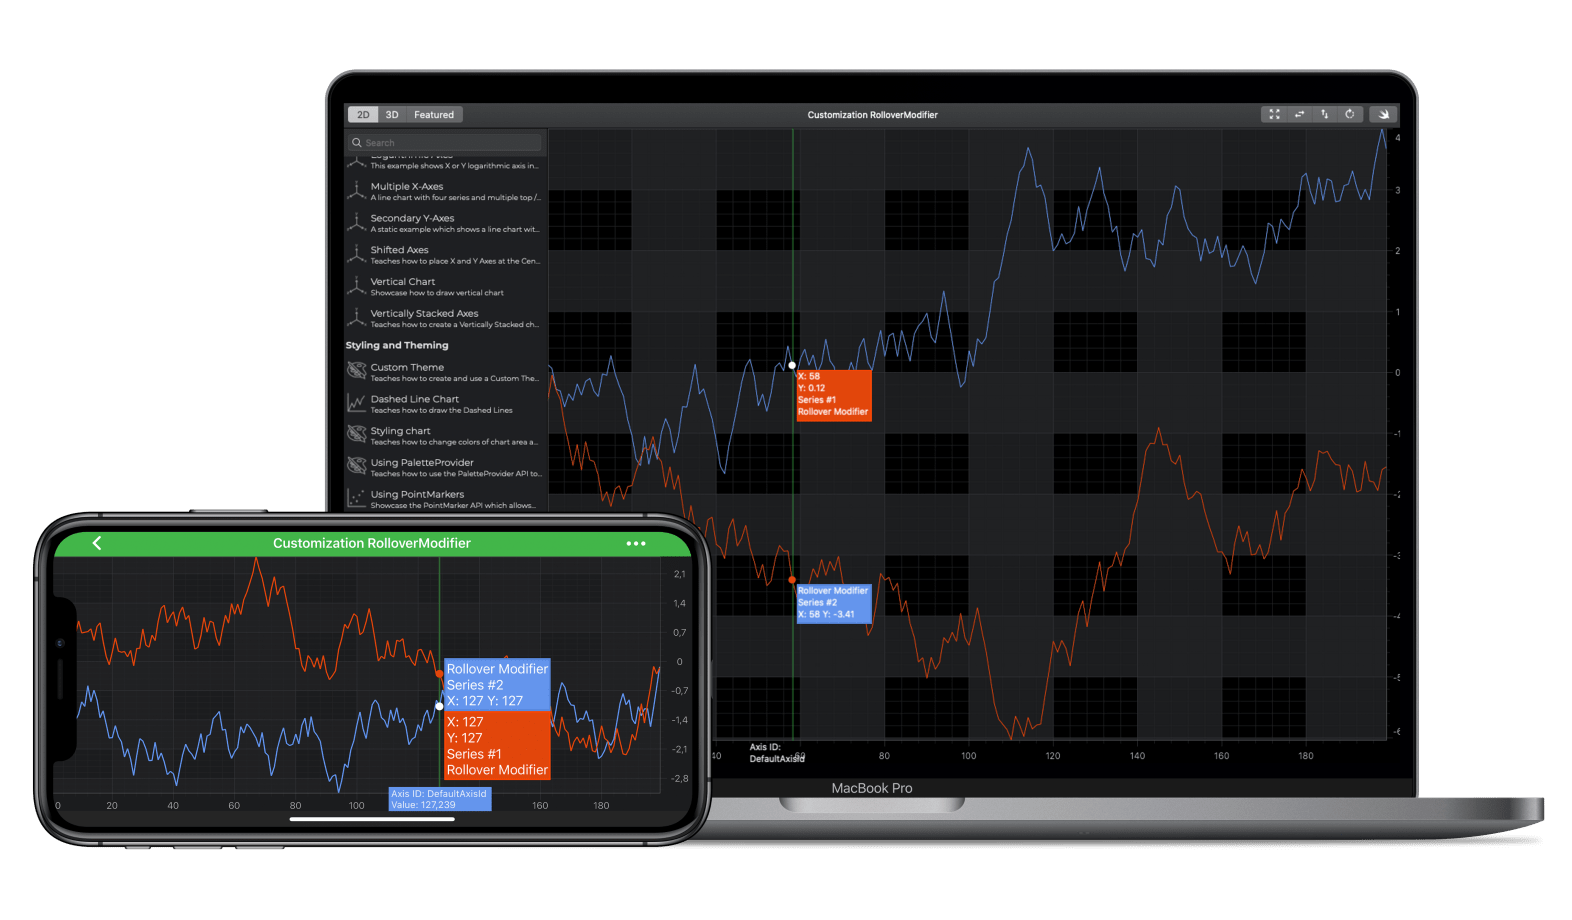
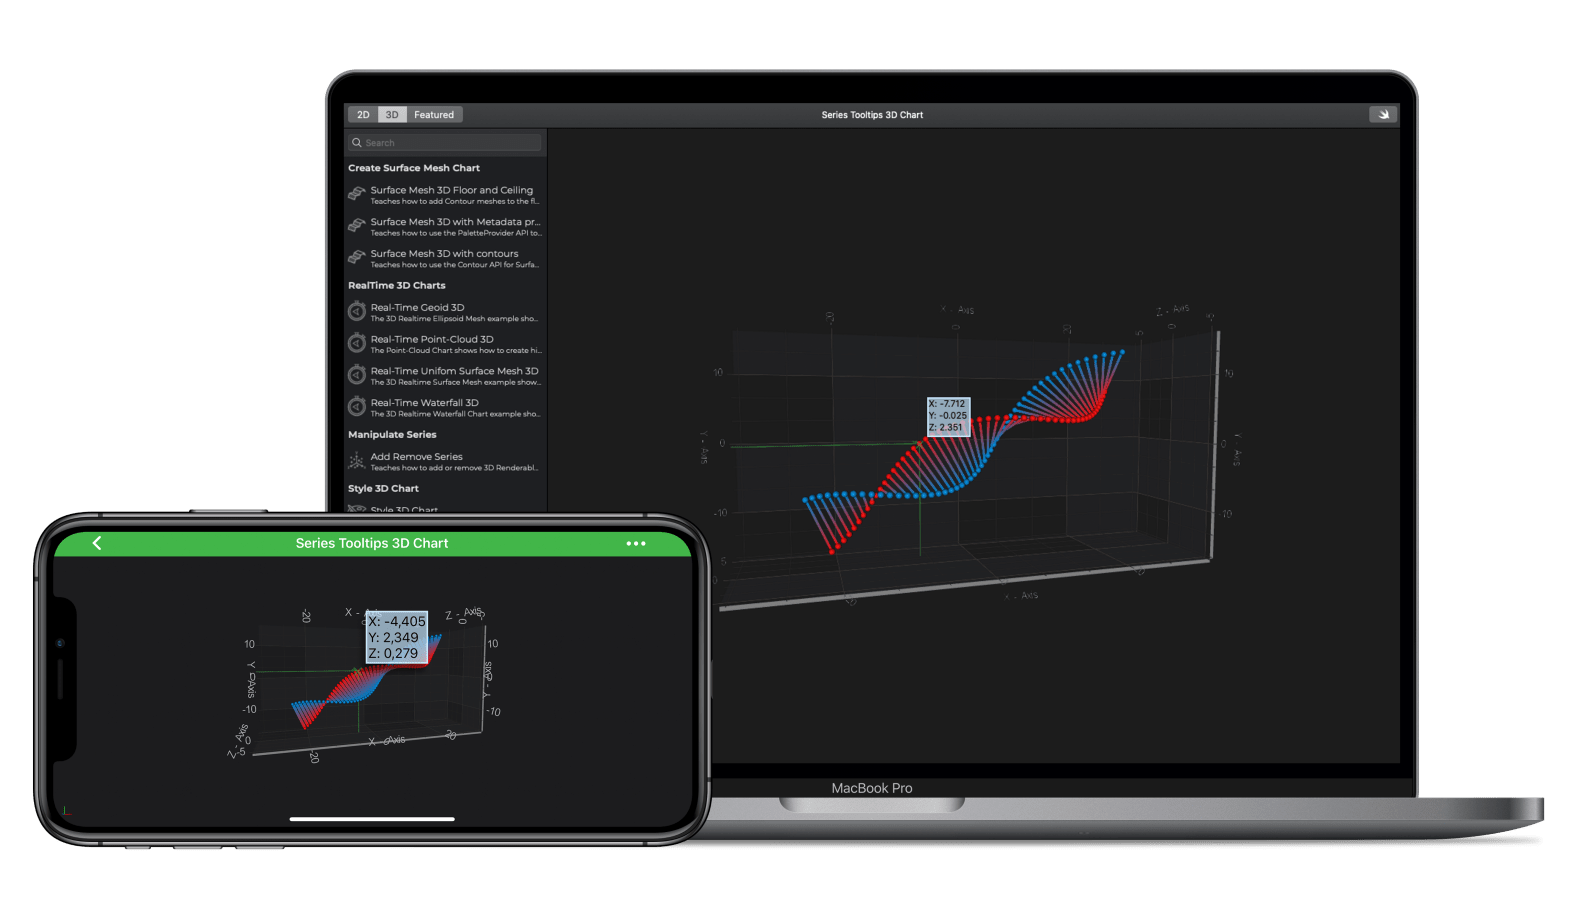
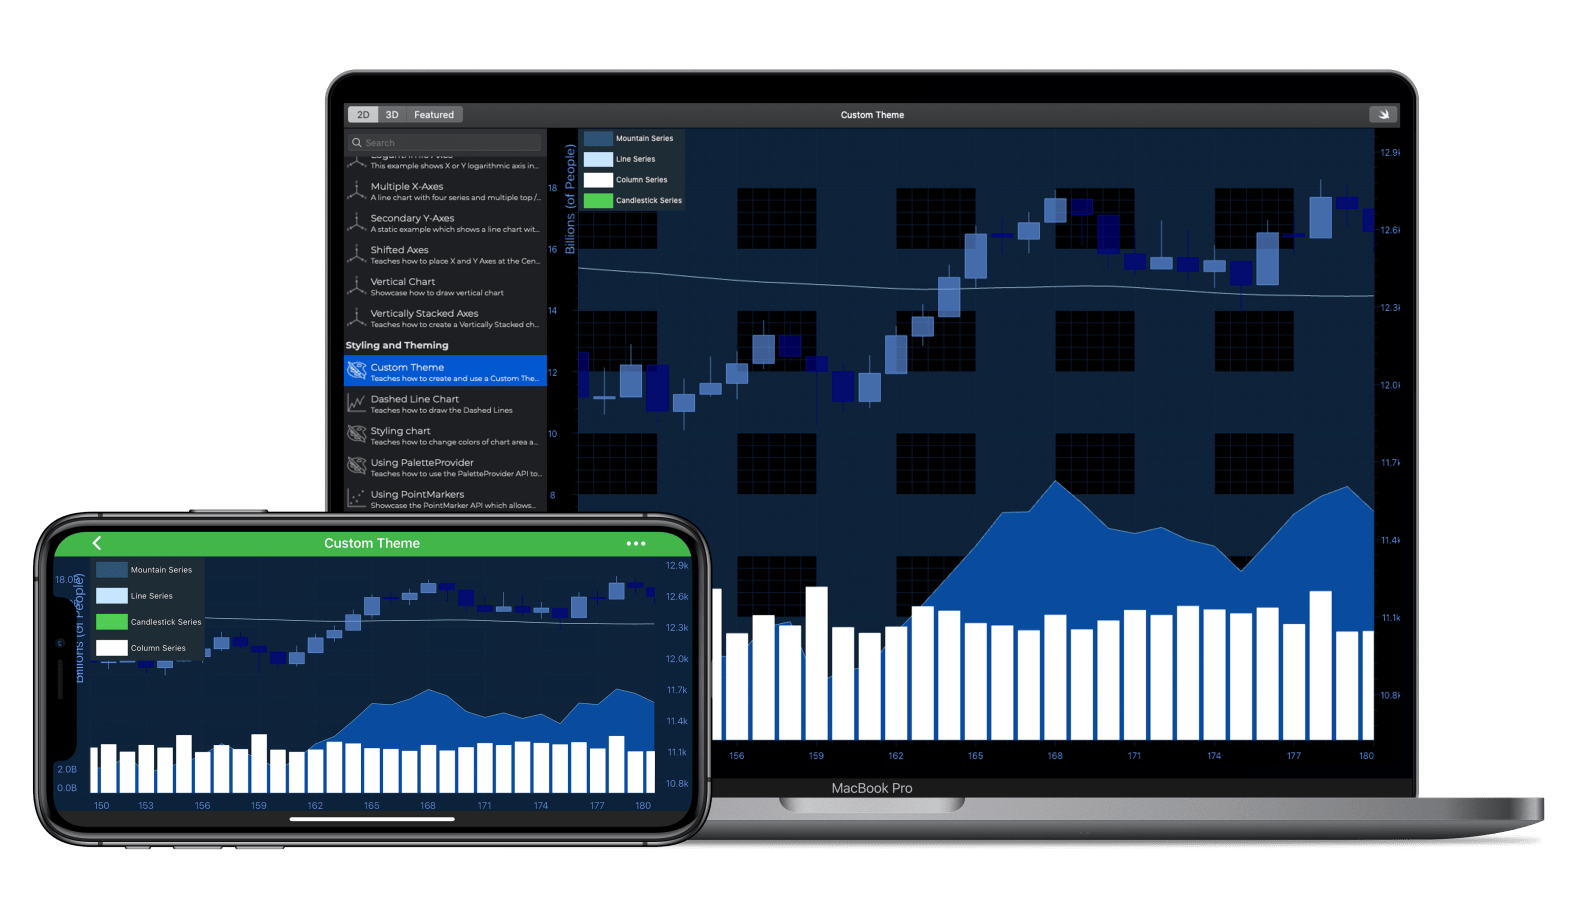
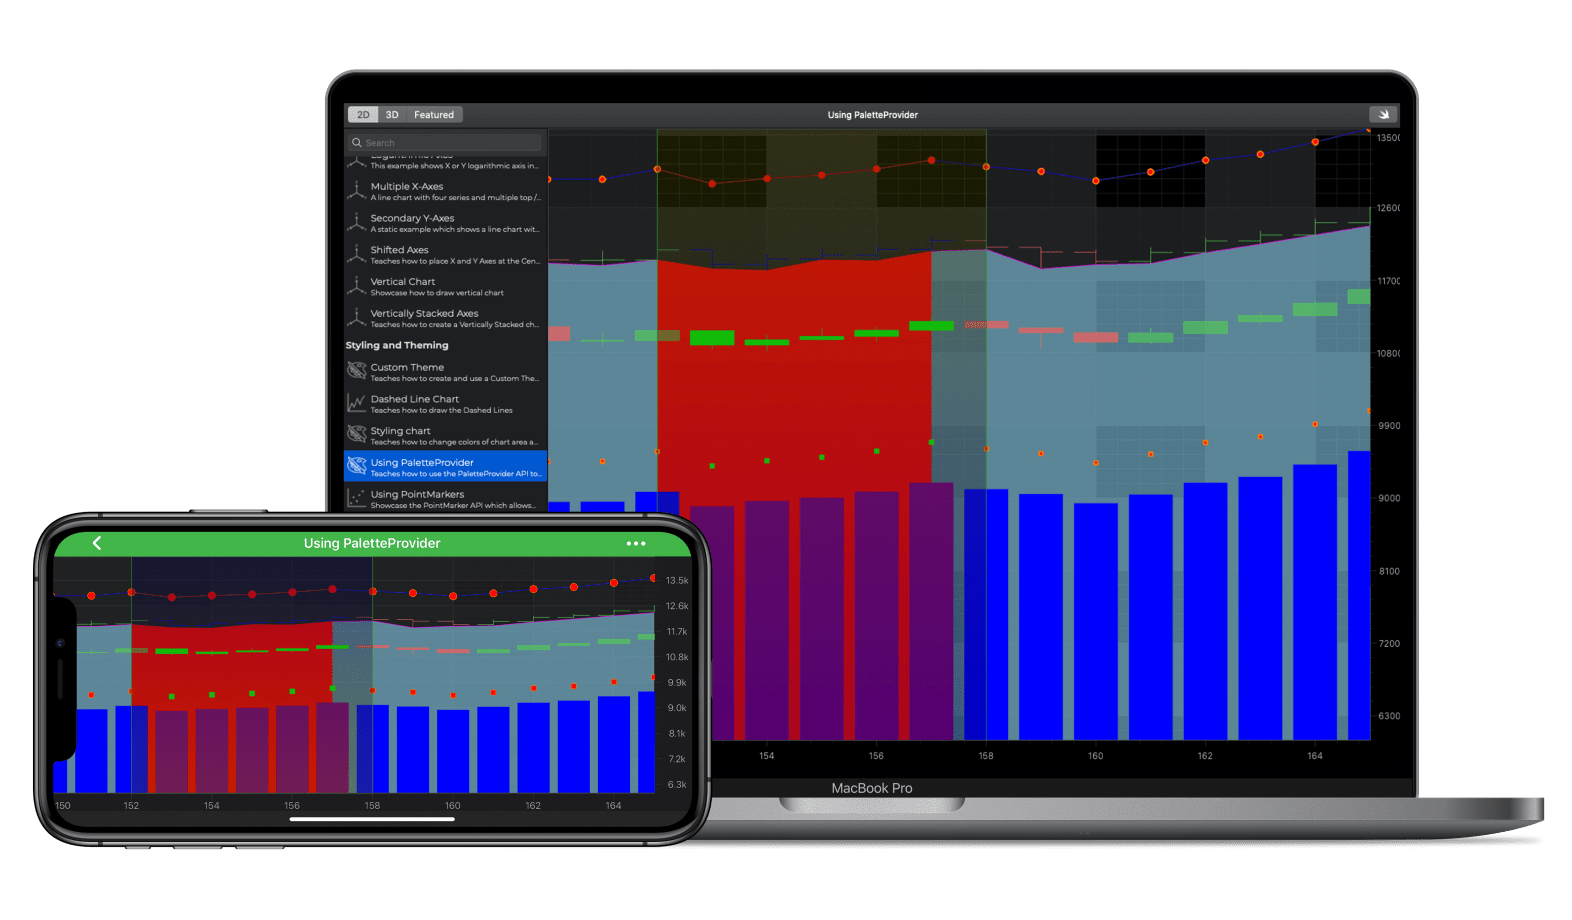
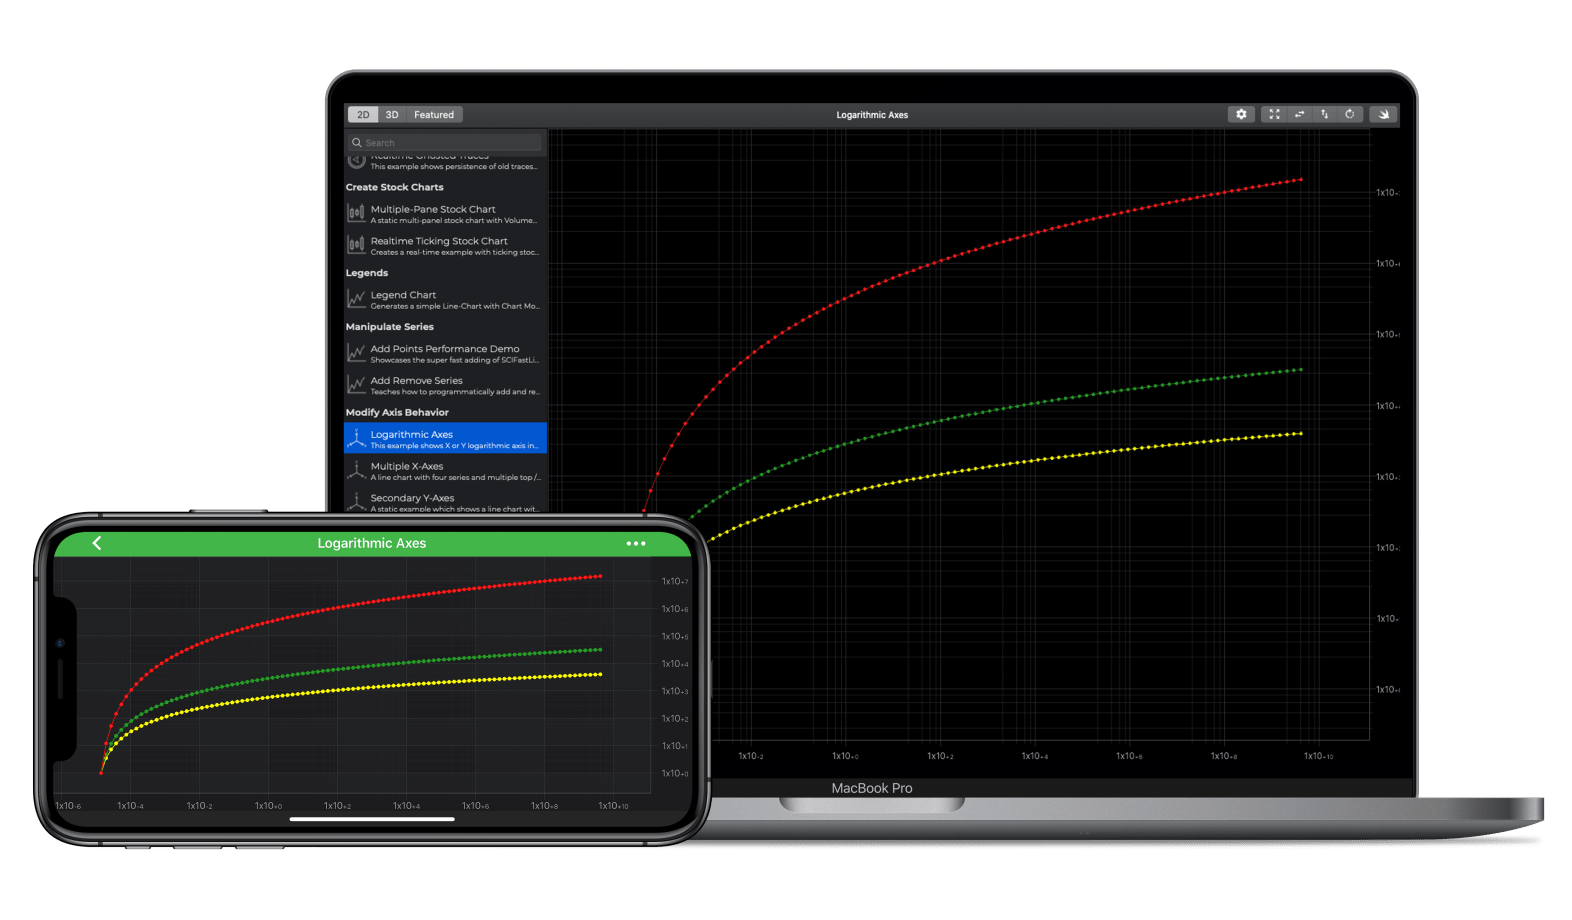
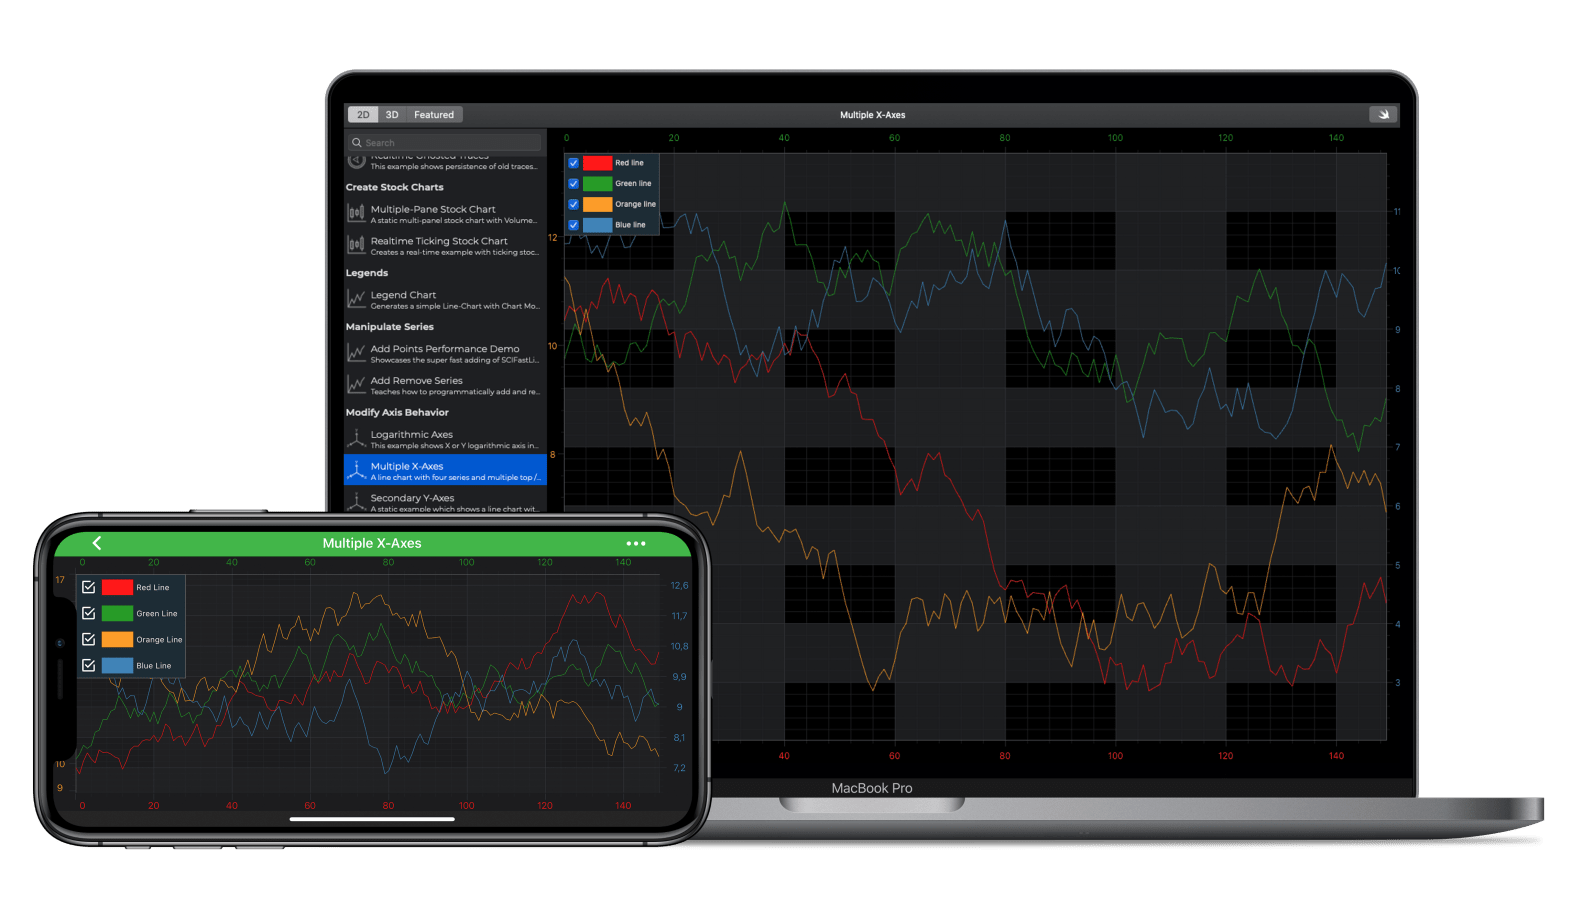
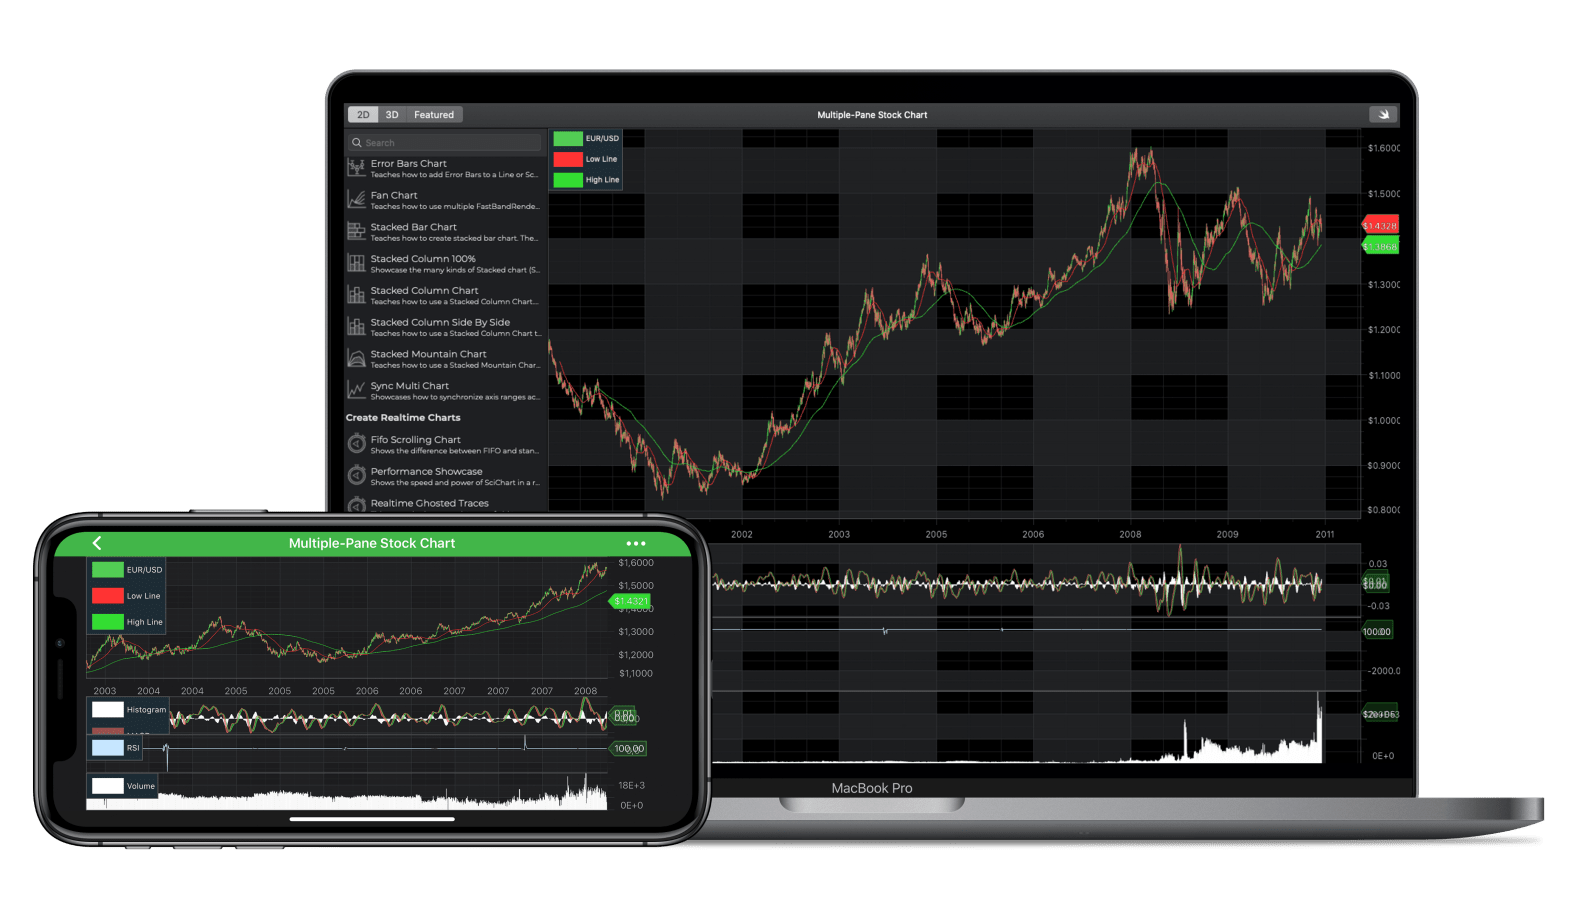
SciChart iOS and macOS v4 is a Feature Rich and Powerful OpenGL ES & Metal 2D & 3D Chart component for Scientific, Medical, Financial and Enterprise apps.

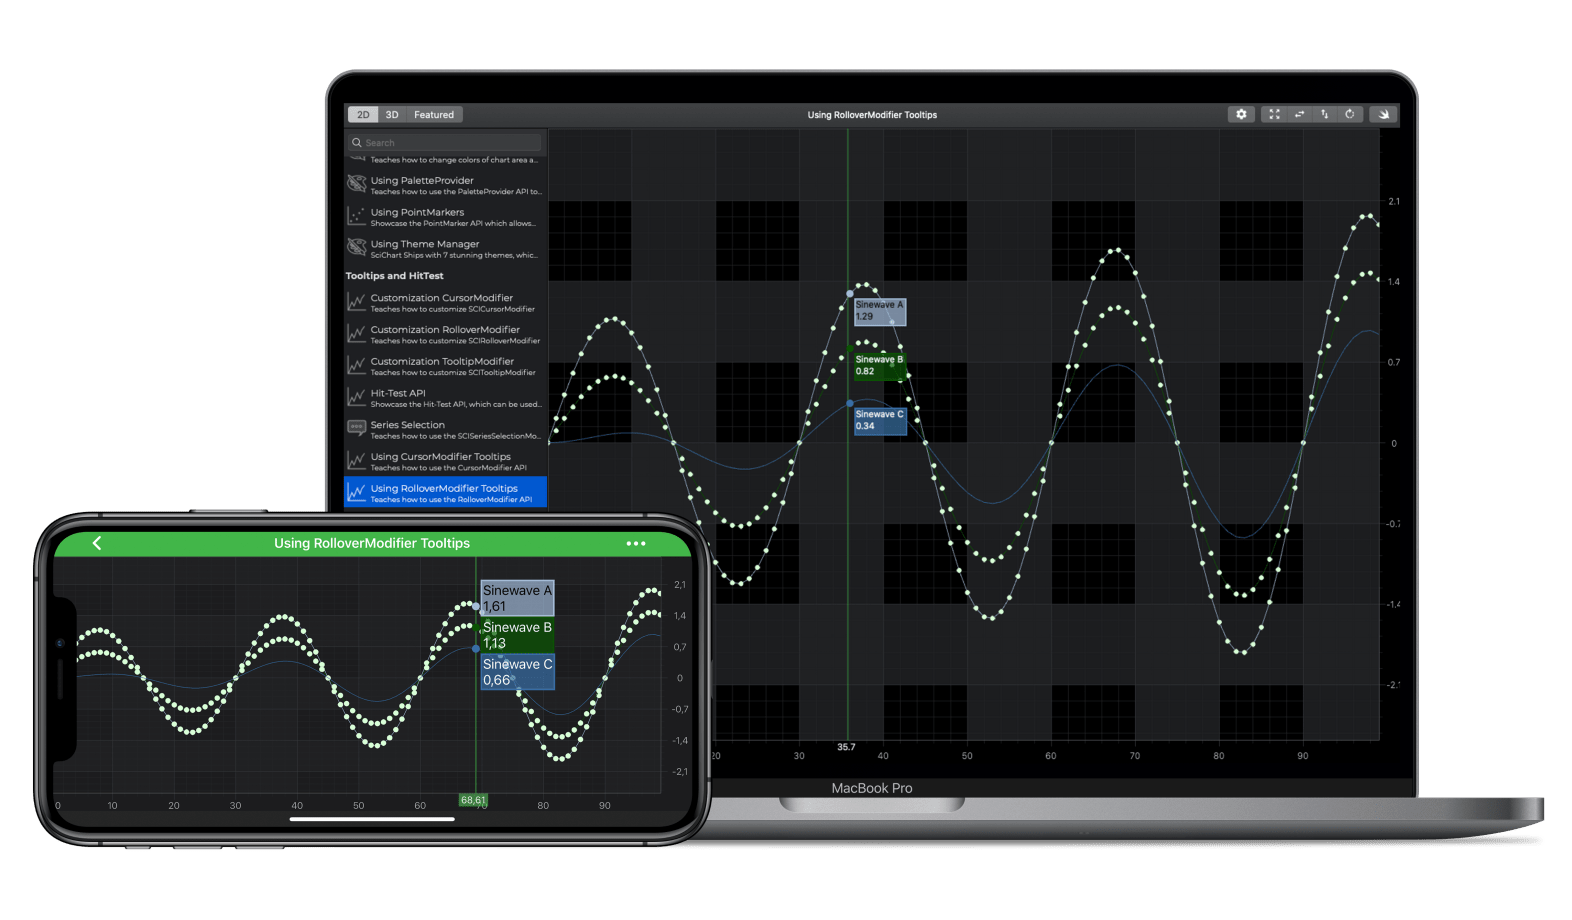
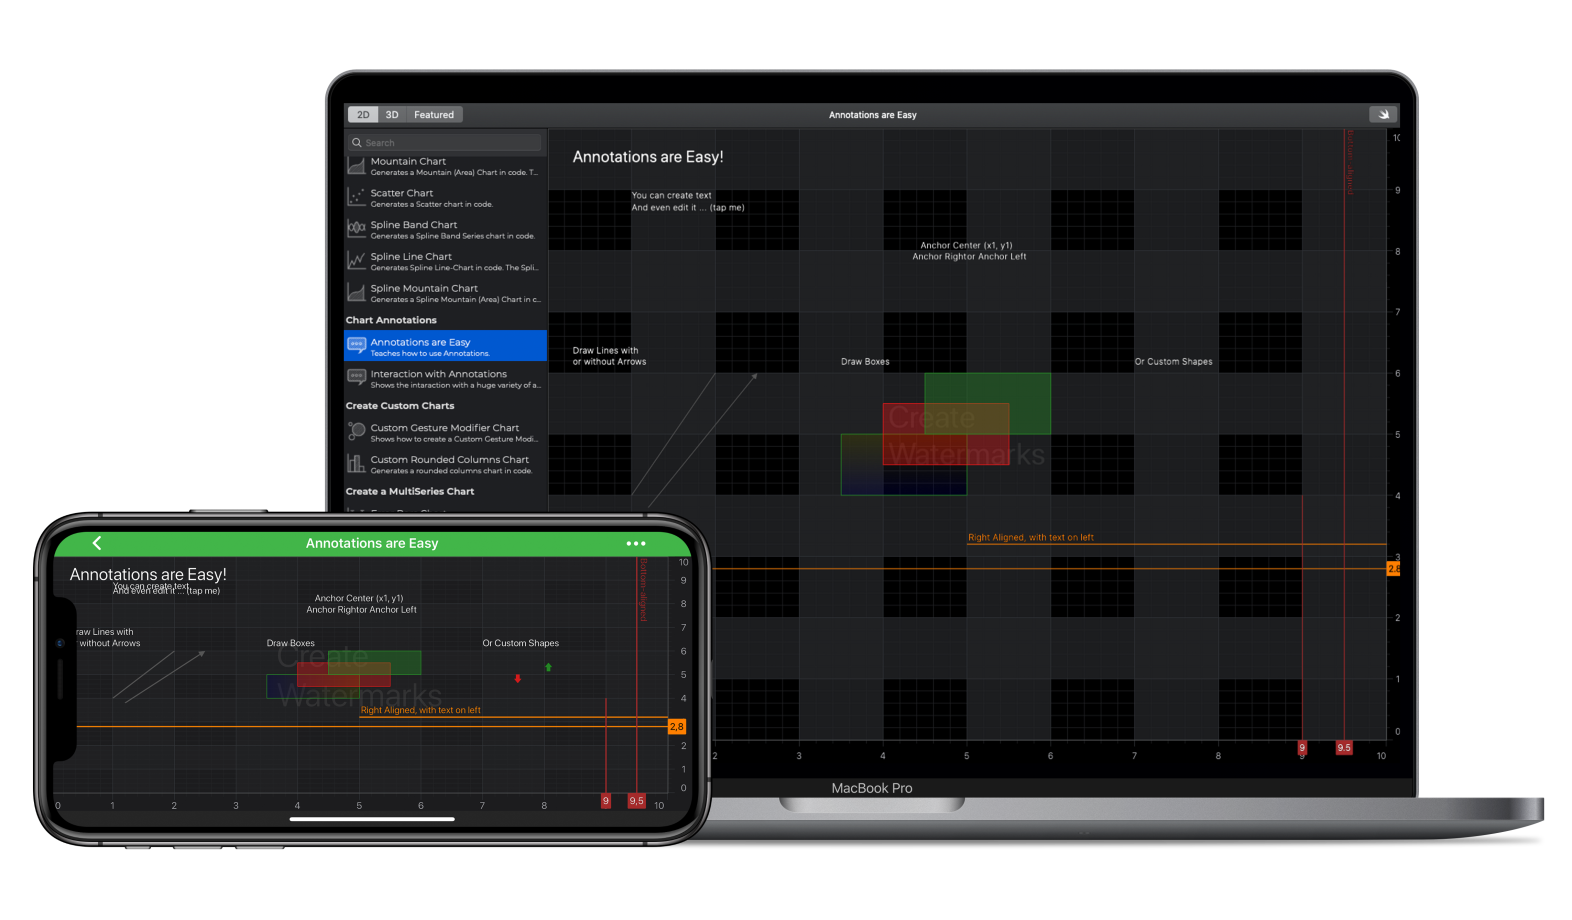
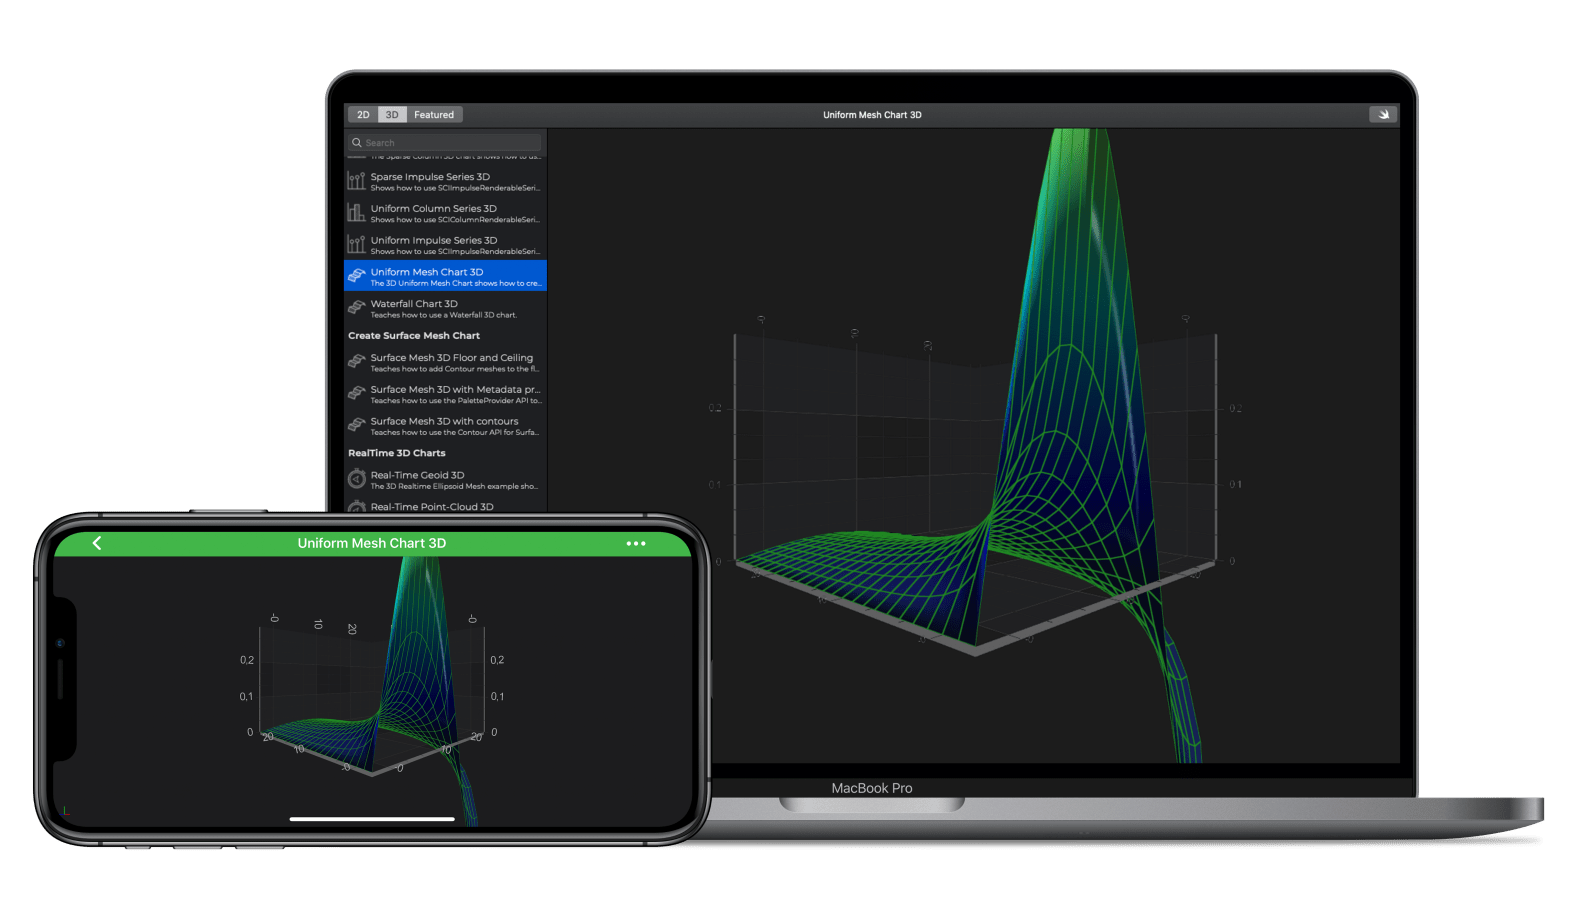
Create stunning 2D & 3D charting applications in Swift, Objective-C or Xamarin.iOS running on iPhone, iPad and Mac.

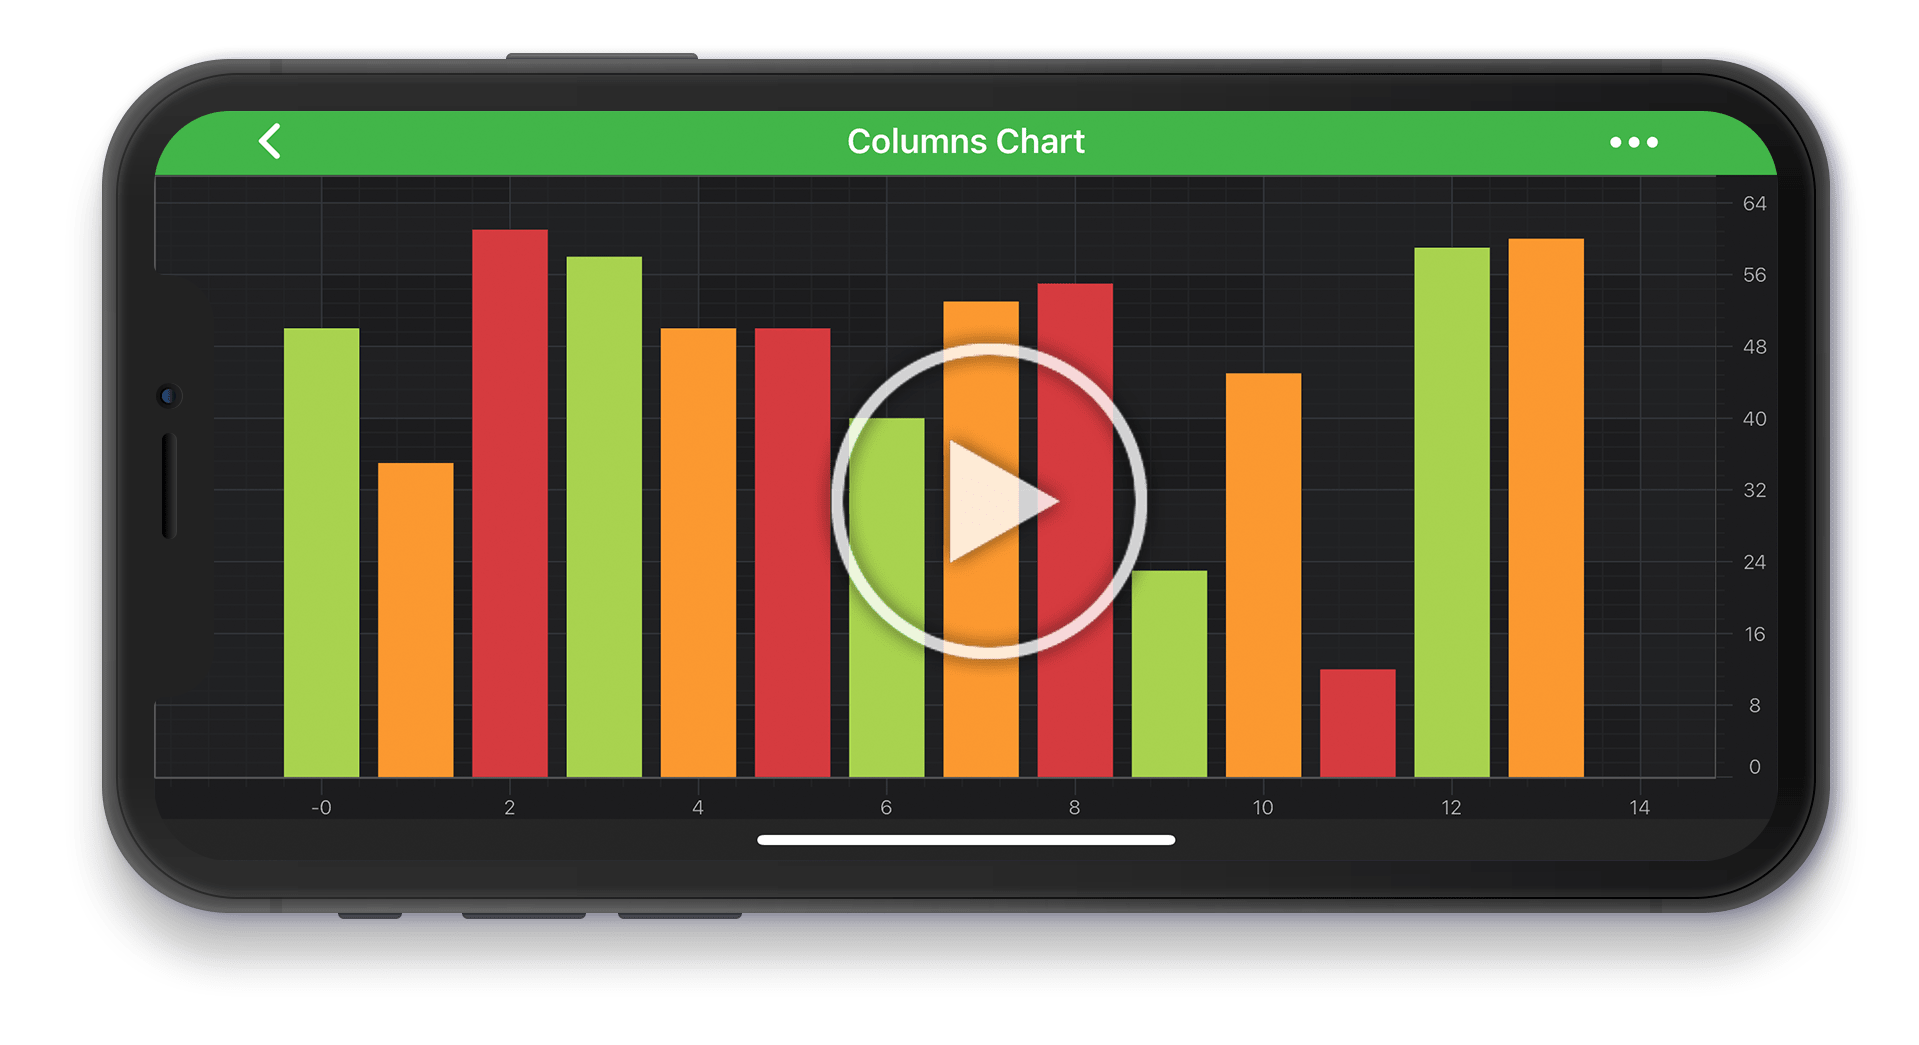
Discover why developers consider SciChart as the best iOS Chart Library for big, complex data visualization.

Start Trial Today Buy Now

Banner Image

macOS & iOS Chart Features

Discover all the iOS chart library features, including interactive elements, customizations and 3D & 2D displays. All come with the capacity for real-time, high-performing iOS data visualization to showcase even the most complex data sets across any device.

Extreme Realtime Performance

For the first time you can create iOS Apps for iPhone, iPad and Mac in Objective-C, Swift and Xamarin which plot many millions of data-points, and still zoom, pan and update interactively. Thanks to our proprietary OpenGLES and Metal rendering engine, our macOS & iOS Chart Library offers instant start-up times and our low memory and CPU footprint will improve your overall device battery life and performance.

Make impossible projects possible with our high performance, realtime iOS & SWIFT macOS charts.

More Comparisons Download Examples

Rich Interactions

SciChart is built for Touch! Rich touch interaction allows you to drag to pan iOS and macOS charts, drag on axis to scale the chart, tap to view tooltips, pinch to zoom in/out and double-tap to reset zoom.

Custom actions are possible using our rich Chart Modifier API, where you can override gestures and create custom zooming, panning or feedback behaviours.

See Examples See Documentation

Annotations & Markers

Our iOS Chart Library as well as macOS Chart Library features a powerful Annotations API which allows you to overlay Line, Text, Boxes or watermarks over the chart, at specific data-point locations.

Custom annotations are possible to display custom markers or points of interest. SciChart supports draggable vertical/horizontal line annotations to mark thresholds or time stamps.

See Examples See Documentation

Plot 3D Point Clouds

Our 3D Scatter / Bubble and Point-cloud chart types allow you to plot 3-dimensional data with XYZ points.

For the first time you can use our powerful SDK to visualise point-cloud outputs from LIDAR, UAV, self-driving car sensors, or plot the relationship between values in scientific, machine learning or statistical data with 3 or 4 (XYZ, Color) or 5 (XYZ, Color, Size) dimensions.

See Examples See Documentation

Cursors & Tooltips

Our iOS and macOS Charts feature rich cursors and tooltips out of the box, which are built on our powerful Chart Modifier API.

Choose from built-in Cursors, Crosshairs, Tooltips on Tap or Rollover (showing vertical lines) as well as Legends. Decide what information is presented in a tooltip. Style a tooltip to fit your application.

See Examples See Documentation

Add Tooltips, Selection to 3D Charts

SciChart for iOS and Mac supports tooltips, data-point selection, series selection, Hit-test APIs and more so that you can get responsive feedback on tap and use our powerful APIs to see which series were interacted by the user.

Using either SciChart iOS 3D Charts or SciChart macOS 3D charts, you can create next-generation apps on the iOS and macOS platform visualizing your data in 3-dimensions. Plus, you can provide intuitive interaction via pinch, tap, drag, and pan.

See Examples See Documentation

Styling and Theming

SciChart’s macOS and iOS Chart Library ships with 8 stunning themes in a Theme Manager, which you can apply to your charts with a single line of code. Themes affect default cursor, zoom, axis, grid and series colors.

You may customize even further and create your own custom theme.

See Examples See Documentation

Chart Animations

The SciChart iOS graph library and charts for Mac desktop support animation functions, to let you fade, sweep, or bounce data when.

The animations API is very flexible and powerful and gives both your macOS and iOS charts that sophisticated look and feel you are looking for.

Our demo application has all the animation types incorporated into the charts. You can download our iOS charts example suite and run it yourself, or get it from the App store.

Download Example Suite Download From App Store

Per-Point Coloring

Our iOS & macOS Chart Framework features per-point coloring using the PaletteProvider API. By hooking into the PaletteProvider API you can return a data-point style or color based on the X,Y data-values.

Use this to color bars, columns, candlesticks, scatter-points or line segments that meet certain criteria, such as exceeding a threshold, or being a point of interest.

See Examples See Documentation

Many Axis Types

iOS Charts and macOS Charts feature many axis types out of the box, including Numeric Axis, Logarithmic Numeric Axis, Date Axis (all of which are value axes).

In addition, SciChart features Category Date Axis which allows displaying of stock charts or trading data while collapsing weekends or overnight gaps.

See Examples See Documentation

Unlimited Multiple X, Y Axis

Our macOS & iOS Charting Library features unlimited, multiple X and Y axes.

You can place X axis at the Top or bottom and Y axis on the Left or Right. Several axes on one side is also possible.

You can rotate charts by displaying the X axis on the Left/Right and the Y axis on the Top/Bottom. You can mix types of axes on the same chart and have unlimited customization as to how your data is scaled.

See Example See Documentation

Link Multiple Charts

SciChart allows you to link multiple iOS charts and charts for macOS together so that they zoom, pan or display tooltips in unison.

This is useful to create complex dashboards where the output from several sensors, data-feeds or database tables can be displayed one above another with a common time-axis.

See Examples See Documentation

Financial/Stock Chart Features

SciChart is built for Scientific, Medical and Financial (Trading) apps, with first-class support for stock charts, including the iOS and macOS Candlestick Chart type, the iOS and macOS Ohlc chart type, Column, Mountain, Area and Line chart type.

The Category Date axis allows collapsing weekend and overnight gaps in trading data.

SciChart’s macOS and iOS Chart Software supports multiple panes and multiple series per chart, allowing you to create complex, multi pane stock chart applications with indicator panels, and even overlay buy/sell markers using our Annotations API.

See Example See Documentation

Plot 3D Scientific Data

SciChart’s iOS chart library for the first time enables plotting 3D scientific data with the 3D surface mesh chart types for your iOS and macOS applications.

With the help of our cross-platform Visual Xccelerator 3D engine you can plot scientific surface mesh charts in real-time with tens of thousands of cells in iPhone, iPad and Mac devices.

See Examples See Documentation

Excellent Tech Support

star starstarstarstarstar 4.84 Average - 419 Reviews

One of SciChart’s main selling points is our tech support. We operate a support-desk for paid customers of SciChart who purchase priority support. We aim to answer requests within one business day. You will be able to speak to the developers who made SciChart and get back to work quickly with our outstanding technical support.

Read Testimonials
quote
Nicolas B
star
star
star
star
star

Easy to use, performance is great, and the support team is very friendly.

quote
David M
star
star
star
star
star

Our WPF reporting application displays dashboards with hundreds of time-series charts over a year’s time. The first charting library we tried made the user wait 15-30 seconds for these dashboards to load. Moving to SciChart practically eliminated render time from our application . Dashboards are viewable on screen in under a second now!

quote
Soner I
star
star
star
star
star

SciChart is a very fast and flexible charting library. The support and the given Examples Suite save us a lot of time.

quote
Kurtis
star
star
star
star
star

Fastest charting solution for WPF. And the most feature-packed too. Top it off with impeccable customer support and very helpful code examples, you won't go wrong at all with SciChart! Highly recommended.

quote
Brad
star
star
star
star
star

We needed a simple line chart control and SciChart was the best we found. SciChart is easy to use, is well documented, and has excellent sample programs. It supports MVVM. We demoed several other products, and we found that many of the charting programs had memory leaks when doing continuous updates. SciChart handles GC really well and we don't see the memory leaks we saw in other programs. Overall we're very pleased with SciChart.

All this starting from $999 / Developer License ($499 second year)

SciChart’s Chart Library and charts for macOS are licensed on a perpetual, per-developer licensing model, with royalty-free redistribution. You get access to the world’s fastest 2D & 3D iOS Charts or macOS charts, starting from just $999 per developer license (first year) for a perpetual iOS license with 1-years tech support and updates and $1,299 for macOS license. Save and buy the bundles, that supports all platforms starting at $1,699.

Download Buy Now

Try SciChart Today

Start a trial and discover why we are the choice
of demanding developers worldwide

Start TrialCase Studies