I have a chart that does not perform well and has a lag.
what I can do to fix this problem?
- abolfazl ghanbari asked 4 years ago
- last active 4 years ago
Hi,
I tried to initialize heatmap chart with NaN to make it transparent, but it doesn’t work that way. The color was blue, which is zero in the colormap. Is there a way to make it not showing any color?
Thanks,
public void initECMSciChart() {
    // initialize chart with NaN
    for (int i = 0; i < MATRIX_COLUMNS; i++) {
        for (int j = 0; j < MATRIX_ROWS; j++) {
            heatmap2DMatrix[i][j] = 0;
            heatmapDataSeries.updateZAt(i, j, Double.NaN);
        }
    }
    heatmapDataSeries.setStartX(0d);
    heatmapSurface.zoomExtentsX();
}
- Gang Xu asked 4 years ago
- last active 4 years ago
I have a few problems that I’m trying to address with y-axis labelling.
- I am including a y-axis on the left side of my graph but want the text of the labels to be right-aligned. Each label uses two lines of text. How can I do that?
- I want the margin of the text to be a specific width so that I can line up the y-axis of multiple scichart surfaces that are stacked vertically. How can I set each of my scichart surfaces to use a particular margin for the y-axis labelling?
- The y-axis label text will wrap when I don’t want it to (see attached image — The text of the label should be “1m \n Left” and I am currently seeing “1m \n Lef \n t”). How do I turn off the wrapping of text on the y-axis?
———-
This is how I am currently implementing the y-axis:
NumericAxis(context).apply {
    drawLabels = true
    axisAlignment = AxisAlignment.Left
    this.labelProvider = labelProvider
    this.tickProvider = tickProvider
    drawMajorBands = false
    drawMajorTicks = false
    drawMinorTicks = false
    drawMajorGridLines = false
    drawMinorGridLines = false
    isLabelCullingEnabled = false
    visibleRange = DoubleRange(
            dataRange.first,
            dataRange.second
    )
    autoRange = AutoRange.Never
    tickLabelStyle = FontStyle(
            TypefaceManager.obtainTypeface(context, CustomTypeface.PROXIMA_NOVA_REG),
            context.resources.getDimension(R.dimen.results_screen_graph_labels_text_size),
            Color.LTGRAY
    )
}
- Marcela Guerra asked 4 years ago
- last active 4 years ago
Hi, I just want to make sure
everything inside com.scichart.charting.visual will be considered as VIEW in MVVM pattern right?
thanks
- Yuda Susanto asked 3 years ago
- last active 3 years ago
Hi
I have added 24 Line graphs for EEG. Now I want to display the name of each channels against each graph. I am using Y steeped graph which you are using for Vital signs display in example code. Can you please let me know how to t to display the name of each channels against each graph
Best Regards,
Aditya
- Aditya Kadambi asked 3 years ago
- last active 3 years ago
What is the best way to form List with my formatted dates in the View Model and just put in my implementation of CategoryLabelProviderBase?
Can an AxisBase implementation help me in this case?
- Iliya Mashin asked 2 years ago
- last active 2 years ago
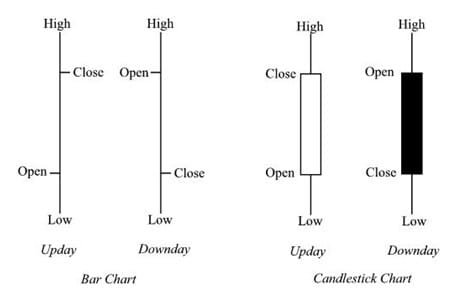
In financial markets, there is a type of chart that is as follows.
I did not find this type of chart in SciChart.
Please help me how to draw this chart
- Vahid Garousi asked 1 year ago
- last active 1 year ago
On VS2017, in LineChartFragment.cs, I am trying to use VerticalSliceModifier, but it is not found.
var verticalSliceModifier = new VerticalSliceModifier();
Thank for your help.
- Lubac Dominique asked 7 years ago
- last active 7 years ago
The online Quick Start Guide includes the code :
PenStyle penStyle = new PenStyle(ColorUtil.Green, true, 2f);
This needs to be updated as PenStyle is now abstract.
Presumably it should now be:
PenStyle penStyle = new SolidPenStyle(ColorUtil.Green, true, 2f, null);
or similar.
- Grant Davidson asked 7 years ago
- last active 7 years ago
Now I using different library for displaing candles.
And have two different styles of candles.
An author of library that I using strongly recomended this one library.
And I try to port my app to SciChart.
How can I change CandlestickSeries to displayed as a Bar Chart
- Evgeny Khramov asked 6 years ago
- last active 6 years ago
Hi,
I downloaded your Android Examples project to evaluate whether it’ll be a good fit for real time updates.
Replaced SetRunTimeLicenseKey call with my trial keys.
Designer time window displays Sorry!you have not set a LicenseKey message.
RunTime displays your trial license expired.
Any help on this would be great.
Thanks
- Raji S asked 6 years ago
- last active 4 years ago
Hi,
I have a line chart and I want to colour the space bellow the line chart with a colour that is different form the background colour. I am not sure what API does that. Please advice.
- Vidya Sagar Mohanraj asked 6 years ago
- last active 6 years ago
Does Sci chart has any framework to support UI Automation in Android/iOS? Also I came across some screenshot based test for verification, Is this available for licensed user to test in Android/iOS?
- santhosh sk asked 5 years ago
- last active 5 years ago
Hello,
I want to use SubDayTextFormatting in android so that when the visible range reaches the same day, e.g. as I zoom, it switches from dd:MMM:yyyy to HH:mm.
How can I do that?
- sci chart asked 4 years ago
Hi, I’m modifying AudioAnalyzer chart example.
- I want to know that how to display time value on XAxis in this example.
In audio stream chart example, xData value store 0 to 2048 value for each onNext.
like this,
final long[] itemsArray = audioData.xData.getItemsArray();
for (int i = 0; i < minBufferSize; i++) {
itemsArray[i] = time++;
}
I want to display time value like “mm:ss” format on XAxis.
What kinds of data should be stored in itemsArray?
How to setup VisibleRange and labelFormat?
- In same example. XAxis lable fixed start to 0(does not move to outside of left for each new data)
How to move xAxis label right to left when new data generated?
Thanks for you kindness.
- YoungTae Sung asked 4 years ago
- last active 4 years ago
Referring to the stacked column side by side example in the android examples collection, if someone clicks on a column/series in that chart, how could i identify which the of columns has been selected (usa, china, india, etc).
- Marcus Maringer asked 3 years ago
- last active 3 years ago
i have been working on line charts and i need to show date as well as time on the axis( 21 june 08 05:30:PM like this).I’ve tried with date axis and numeric axis ,but it doesn’t helps.Do we have any suggestions or samples which could help me
- Vinu Gilbert asked 3 years ago
- last active 3 years ago
thank you for answer !
Additional questions
image is attached
q1. last data only marker
q2. vertical dotted line (with rolloverModifier)
- young kwang kwon asked 3 years ago
- last active 3 years ago
Hello, I am a new developer who continues to develop scichart. In the currentPoint (or its name may be different) created after clicking in the developed application, the changes made on the graphic (changing the data, changing the graphic type, zooming in or out of the graphic, etc.), leaving these points where they are, breaks the graphic. In these cases, I need to either remove the point or make it move with the graph. how can I do that? I am developing with java. I uploaded the problem I encountered as a gif, you can understand it more clearly when you watch it.
- devrim çatak asked 2 years ago
- last active 5 months ago
Hi, I’d like to preview SciChartSurface in Compose using @Preview annotation.
I am getting error
java.lang.NoClassDefFoundError: Could not initialize class com.scichart.drawing.canvas.RenderSurface$d
@Composable
fun MyAndroidViewPreview() {
    val context = LocalContext.current
    AndroidView(
        factory = { context ->
            // Create Android View with SciChartSurface
            SciChartSurface(context)
        },
        update = { view ->
            // Update Android View here
        }
    )
}

@Preview
@Composable
fun MyAndroidViewPreviewWrapper() {
    MyAndroidViewPreview()
}
- Sebastian Paciorek asked 1 year ago
I see there is a Polar chart type for WPF charts and that one is “coming soon” to Android. Is it known when we can expect it to be available on Android?
Thank you in advance.
- MIha Rozina asked 7 years ago
- last active 6 years ago
I am trying to use SciChart library for my project and find out whether it satisfy all requirements.
I am currently trying to display the ECG signal. Therefore the data is coming in realtime.
I have the following configuration
 final NumericAxis xAxis = mSciChartBuilder
                .newNumericAxis()
                .withAxisTitle("Time (seconds)")
                .withDrawLabels(false)
                .withDrawMajorTicks(false)
                .withDrawMinorTicks(false)
                .withDrawMajorBands(false)
                .withDrawMajorGridLines(false)
                .withDrawMinorGridLines(false)
               // .withVisibleRange(0, 2040)
                .withAutoRangeMode(AutoRange.Always)
                //.withAutoRangeMode(AutoRange.Never)
                .build();
        final NumericAxis yAxis = mSciChartBuilder
                .newNumericAxis()
                .withAxisTitle("Voltage (mV)")
                //    .withGrowBy(0.1d, 0.1d)
                .withDrawLabels(false)
                .withDrawMajorTicks(false)
                .withDrawMinorTicks(false)
                .withDrawMajorBands(false)
                .withDrawMajorGridLines(false)
                .withDrawMinorGridLines(false)
                .withVisibleRange(Short.MIN_VALUE, Short.MAX_VALUE)
                .build();
It works but the X axis a little bit scaled/compress.
Here is the result
enter image description here
I need to make it a bit wider.
How can I do this ?
I have tried to set range manually like that
.withVisibleRange(0, 2040)
However in this case it doesn’t show anything.
I would be grateful for any help.
UPDATE
https://drive.google.com/file/d/17p1E-Z_YxiVh_JtwEvlM1PaTVyJ7eyz7/view
- Durian Odour asked 6 years ago
- last active 6 years ago
Hi all,
I’m developing an app which receives and displays 100’s of samples per second similar to what you would see with the FIFO tutorial. Instead of the sample number, 1000, 1001, etc., I’d like to show seconds so far instead of the sample number.
For example, at sample 1000 display 10, from 1001 to 1099 display nothing, at 1100 display 11, etc. Something simple like sampleNum/100. Can you give me a hint where to start looking to change the behavior of the (major?) tick markings? Do I do something with the NumericAxis class?
Thank you for pointers.
Ed
- Ed Chambers asked 6 years ago
- last active 6 years ago
How to reduce size of colored rectangle of the legends ?
- Developer Mt asked 6 years ago
- last active 6 years ago
Hi,
I have a question as to whether it is possible to draw major gridlines to end at the renderSeries surface. Something similar to the attached image.
- Vidya Sagar Mohanraj asked 6 years ago
- last active 6 years ago
Hi,
I am currently using SciChartDebugLogger to enable logging but I am not sure what information the vararg provides
public void logInfo(String tag, String stringFormat, Object... args) { }
what does the arg object provide? can it be converted to a readable string format? what does the string format mean?
- Vidya Sagar Mohanraj asked 5 years ago
- last active 5 years ago
Hi Everybody,
I use a FastLineRenderableSeries with an XyDataSeries,
when I append data with a negative incrementation of X value,
nothing seems to be drawn
for example:
 Clear();
 for (int i = 0; i < 100; i++)
 {
      Append(100-i, i);
 }
 ZoomExtents();
but this example is working
 Clear();
 for (int i = 0; i < 100; i++)
 {
      Append(i, i);
 }
 ZoomExtents();
Is there a way to get this working? In my application data comes in real time, so I can’t sort them.
Thanks in advance for your help.
- Guillaume Bishop asked 5 years ago
- last active 5 years ago
Hi,
I am working on Scichart android appliication.By default it is appending infinite Yvalues which are randomly generated one by one. I want to append finite data in AnimatingLineChartFragment() but it will not accept it, like when I append arrayList of yValue it will generate an error and ask to add Collections.singleton(t) on 1st argument .Afterwards when I run the programme it works fine but when Fifo Capacity ends it starts to draw last line again and again. Plz help me that how can Animate Lines on my data?
- hamza kiani asked 5 years ago
- last active 5 years ago
I want to show my values between (-10,60) but the y axis is adjusting automatically according to data .
- Vipul Chaurasia asked 4 years ago
- last active 4 years ago
I have two questions on rollover modifier.
One is the tooltip of the rollover is right under the finger on a heatmap chart. Can I move it to the top left section of the touch point?
Second question is how can I implement a callback function whenever Y axis of the rollover modifier changes?
Thanks for your attention in advance.
- Gang Xu asked 4 years ago
- last active 4 years ago
How do I know when user edited the text on TextAnnoation so the app can save it?
How to do the same for https://www.scichart.com/questions/wpf/get-textannotation-text-after-user-editing for Android and iOS version of SciChart?
- Zhiheng Cao asked 4 years ago
- last active 4 years ago
Hi,
Im tried to convert date into xAxis using this tutorial
but i got this error
Java.lang.RuntimeException: Unable to start activity ComponentInfo{}: java.lang.NullPointerException: Attempt to invoke interface method 'java.lang.Object com.scichart.data.numerics.math.IMath.fromDouble(double)' on a null object reference
- Yuda Susanto asked 3 years ago
- last active 3 years ago
When I open the activity with the chart , I see a black screen. And there is no graph displayed.
I have a trial license key which is valid.
Here is my full code:
xml file:
<?xml version="1.0" encoding="utf-8"?>

<LinearLayout xmlns:android="http://schemas.android.com/apk/res/android"
xmlns:tools="http://schemas.android.com/tools"
android:layout_width="match_parent"
android:layout_height="match_parent"
android:id="@+id/chart_layout"
android:orientation="vertical">
Activity:
public class ECGMonitorFragment extends AppCompatActivity {

@Override
protected void onCreate(Bundle savedInstanceState) {
    super.onCreate(savedInstanceState);
    try {
        com.scichart.charting.visuals.SciChartSurface.setRuntimeLicenseKey("");
    } catch(Exception e){

        Log.e("SciChart", "Error while accesing the license", e);
    }


    setContentView(R.layout.activity_ecgmonitor_fragment);


    // Create a SciChartSurface
    final SciChartSurface surface = new SciChartSurface(this);

    // Get a layout declared in "activity_main.xml" by id
    LinearLayout chartLayout = (LinearLayout) findViewById(R.id.chart_layout);

    // Add the SciChartSurface to the layout
    chartLayout.addView(surface);

    // Initialize the SciChartBuilder
    SciChartBuilder.init(this);

    // Obtain the SciChartBuilder instance
    final SciChartBuilder sciChartBuilder = SciChartBuilder.instance();

    // Create a numeric X axis
    final IAxis xAxis = sciChartBuilder.newNumericAxis()
            .withAxisTitle("X Axis Title")
            .withVisibleRange(-5, 15)
            .build();

    // Added in Tutorial #8 - two Y axes
    // Create a numeric axis, right-aligned
    final IAxis yAxisRight = sciChartBuilder.newNumericAxis()
            .withAxisTitle("Primary")
            // Assign a unique ID to the axis
            .withAxisId("primaryYAxis")
            .withAxisAlignment(AxisAlignment.Right)
            .build();

    // Create another numeric axis, left-aligned
    final IAxis yAxisLeft = sciChartBuilder.newNumericAxis()
            .withAxisTitle("Secondary")
            // Assign a unique ID to the axis
            .withAxisId("secondaryYAxis")
            .withAxisAlignment(AxisAlignment.Left)
            .withGrowBy(0.2,0.2)
            .build();

    // Add both Y axes to the YAxes collection of the surface
    Collections.addAll(surface.getYAxes(), yAxisLeft, yAxisRight);

    // Added in Tutorial #3
    // Add a bunch of interaction modifiers to a ModifierGroup
    ModifierGroup chartModifiers = sciChartBuilder.newModifierGroup()
            // Setting MotionEventsGroup
            .withMotionEventsGroup("SharedMotionEvents").withReceiveHandledEvents(true)
            .withPinchZoomModifier().build()
            .withZoomPanModifier().withReceiveHandledEvents(true).build()
            .withZoomExtentsModifier().withReceiveHandledEvents(true).build()
            .withXAxisDragModifier().withReceiveHandledEvents(true).withDragMode(AxisDragModifierBase.AxisDragMode.Scale).withClipModeX(ClipMode.None).build()
            .withYAxisDragModifier().withReceiveHandledEvents(true).withDragMode(AxisDragModifierBase.AxisDragMode.Pan).build()
            .build();

    // Add the X axis to the XAxes collection of the surface
    Collections.addAll(surface.getXAxes(), xAxis);

    // Add the interactions to the ChartModifiers collection of the surface
    Collections.addAll(surface.getChartModifiers(), chartModifiers);

    // Added in Tutorial #6 - FIFO (scrolling) series
    // Create a couple of DataSeries for numeric (Int, Double) data
    // Set FIFO capacity to 500 on DataSeries
    final int fifoCapacity = 500;

    final XyDataSeries lineData = sciChartBuilder.newXyDataSeries(Integer.class, Double.class)
            .withFifoCapacity(fifoCapacity)
            .build();
    final XyDataSeries scatterData = sciChartBuilder.newXyDataSeries(Integer.class, Double.class)
            .withFifoCapacity(fifoCapacity)
            .build();

    // Create and configure a line series
    final IRenderableSeries lineSeries = sciChartBuilder.newLineSeries()
            .withDataSeries(lineData)
            // Register on a particular Y axis using its ID
            .withYAxisId("primaryYAxis")
            .withStrokeStyle(ColorUtil.LightBlue, 2f, true)
            .build();

    // Create an Ellipse PointMarker for the Scatter Series
    EllipsePointMarker pointMarker = sciChartBuilder
            .newPointMarker(new EllipsePointMarker())
            .withFill(ColorUtil.LightBlue)
            .withStroke(ColorUtil.Green, 2f)
            .withSize(10)
            .build();

    // Create and configure a scatter series
    final IRenderableSeries scatterSeries = sciChartBuilder.newScatterSeries()
            .withDataSeries(scatterData)
            // Register on a particular Y axis using its ID
            .withYAxisId("primaryYAxis")
            .withPointMarker(pointMarker)
            .build();

    // Add a RenderableSeries onto the SciChartSurface
    surface.getRenderableSeries().add(scatterSeries);
    surface.getRenderableSeries().add(lineSeries);
    surface.zoomExtents();

    // Added in Tutorial #5
    // Create a LegendModifier and configure a chart legend
    ModifierGroup legendModifier = sciChartBuilder.newModifierGroup()
            .withLegendModifier()
            .withOrientation(Orientation.HORIZONTAL)
            .withPosition(Gravity.CENTER_HORIZONTAL | Gravity.BOTTOM, 10)
            .build()
            .build();

    // Add the LegendModifier to the SciChartSurface
    surface.getChartModifiers().add(legendModifier);

    // Create and configure a CursorModifier
    ModifierGroup cursorModifier = sciChartBuilder.newModifierGroup()
            // Setting MotionEventsGroup
            .withMotionEventsGroup("SharedMotionEvents").withReceiveHandledEvents(true)
            .withCursorModifier().withShowTooltip(true).build()
            .build();

    // Add the CursorModifier to the SciChartSurface
    surface.getChartModifiers().add(cursorModifier);

    // Added in Tutorial #9 - one more SciChartSurface
    final SciChartSurface surface2 = new SciChartSurface(this);

    // Add the SciChartSurface to the layout
    chartLayout.addView(surface2);

    // Set layout parameters for both surfaces
    LinearLayout.LayoutParams layoutParams = new LinearLayout.LayoutParams(LinearLayout.LayoutParams.MATCH_PARENT, LinearLayout.LayoutParams.MATCH_PARENT, 1.0f);
    surface.setLayoutParams(layoutParams);
    surface2.setLayoutParams(layoutParams);

    // Create a numeric X axis
    final IAxis xAxis2 = sciChartBuilder.newNumericAxis()
            .withAxisTitle("X Axis Title")
            .withVisibleRange(-5, 15)
            .build();

    // Create a numeric axis
    final IAxis yAxisRight2 = sciChartBuilder.newNumericAxis()
            .withAxisTitle("Primary")
            .withAxisId("primaryYAxis")
            .withAxisAlignment(AxisAlignment.Right)
            .build();

    // Create another numeric axis
    final IAxis yAxisLeft2 = sciChartBuilder.newNumericAxis()
            .withAxisTitle("Secondary")
            .withAxisId("secondaryYAxis")
            .withAxisAlignment(AxisAlignment.Left)
            .withGrowBy(0.2, 0.2)
            .build();

    // Add the Y axis to the YAxes collection of the surface
    Collections.addAll(surface2.getYAxes(), yAxisLeft2, yAxisRight2);

    // Add the X axis to the XAxes collection of the surface
    Collections.addAll(surface2.getXAxes(), xAxis2);

    // Create and configure an area series
    final IRenderableSeries areaSeries = sciChartBuilder.newMountainSeries()
            .withDataSeries(scatterData)
            .withYAxisId("primaryYAxis")
            .withStrokeStyle(ColorUtil.LightBlue, 2f, true)
            .withAreaFillColor(ColorUtil.argb(ColorUtil.LightSteelBlue, 0.6f))
            .build();

    // Add the area series to the RenderableSeries collection of the surface
    Collections.addAll(surface2.getRenderableSeries(), areaSeries);

    // Create the second collection of chart modifiers
    ModifierGroup chartModifiers2 = sciChartBuilder.newModifierGroup()
            // Setting MotionEventsGroup
            .withMotionEventsGroup("SharedMotionEvents").withReceiveHandledEvents(true)
            .withZoomExtentsModifier().withReceiveHandledEvents(true).build()
            .withZoomPanModifier().withReceiveHandledEvents(true).build()
            .withPinchZoomModifier().withReceiveHandledEvents(true).build()
            .withCursorModifier().withReceiveHandledEvents(true).build()
            .build();

    // Add the interactions to the ChartModifiers collection of the surface
    Collections.addAll(surface2.getChartModifiers(), chartModifiers2);

    TimerTask updateDataTask = new TimerTask() {
        private int x = 0;

        @Override
        public void run() {
            UpdateSuspender.using(surface, new Runnable() {
                @Override
                public void run() {
                    lineData.append(x, Math.sin(x * 0.1));
                    scatterData.append(x, Math.cos(x * 0.1));

                    // Added in Tutorial #7
                    // Add an annotation every 100 data points
                    if(x%100 == 0) {
                        TextAnnotation marker = sciChartBuilder.newTextAnnotation()
                                // Register on a particular Y axis using its ID
                                .withYAxisId("primaryYAxis")
                                .withIsEditable(false)
                                .withText("N")
                                .withBackgroundColor(ColorUtil.Green)
                                .withX1(x)
                                .withY1(0.0)
                                .withVerticalAnchorPoint(VerticalAnchorPoint.Center)
                                .withHorizontalAnchorPoint(HorizontalAnchorPoint.Center)
                                .withFontStyle(20, ColorUtil.White)
                                .withZIndex(1)
                                .build();

                        surface.getAnnotations().add(marker);

                        // Remove one annotation from the beginning
                        // in the FIFO way
                        if(x > fifoCapacity){
                            surface.getAnnotations().remove(0);
                        }
                    }

                    // Zoom series to fit the viewport
                    surface.zoomExtents();
                    surface2.zoomExtents();
                    ++x;
                }
            });
        }
    };

    Timer timer = new Timer();

    long delay = 0;
    long interval = 10;
    timer.schedule(updateDataTask, delay, interval);

}
}
- Aditya Kadambi asked 3 years ago
- last active 3 years ago
Hello
Is it possible do detect taps/selection/click over Axis Titles?
Thanks!
- Rodrigo Garcia asked 2 years ago
do you have offline version of android charts.
my computer is not connected to the internet.
thanks
- shay hadar asked 7 years ago
- last active 7 years ago
Hello.
I have found out that calling suspendUpdate() and resumeUpdate() on a SciChartSurface object allocates memory that is never released. The allocations get bigger with more data in the chart.
I have created an empty Android project. I have added a SciChartSurface and a Button. Pressing the button suspends and resumes updates. You can then see in the Android Monitor that after each press of the button the memory consumption of the app increases. Since the chart is empty the allocations are very small but still noticeable. I have attached the zip of the example project.
Kotlin code of the Activity in the project:
class MainActivity : AppCompatActivity()
{
    override fun onCreate(savedInstanceState: Bundle?)
    {
        super.onCreate(savedInstanceState)
        setContentView(R.layout.activity_main)

        val layout = findViewById(R.id.layout) as ConstraintLayout

        val chartSurface = SciChartSurface(this)
        layout.addView(chartSurface)

        val button = findViewById(R.id.button) as Button
        button.setOnClickListener {
            val suspender = chartSurface.suspendUpdates()
            chartSurface.resumeUpdates(suspender)
        }
    }
}
I
P.S.:
I have tried to open a priority ticket, but I got the following error:
We encountered a problem (cross-site request forgery detected); please try again
Sorry, we encountered a problem (invalid department). Please start over.
- MIha Rozina asked 7 years ago
- last active 7 years ago
How to limit the multiplier of enlargement and reduction when enlarging and reducing
- Huang haiyan asked 6 years ago
- last active 6 years ago
Hi,
I want to customize the style of stick such that
1. Green and hollow stick if it is rising and open higher than close
2. Green and fill stick if it is rising and open lower than close
3. Red and hollow stick if it is falling and open higher than close
4. Red and fill stick if it is falling and open lower than close
How could i achieve that with only one candle series?
- tommy ng asked 6 years ago
- last active 6 years ago
issue resolved….it happened due to late initialization of super class instance for context.
- Praween Kumar asked 5 years ago
- last active 5 years ago
I would like to be able to have a Pie Chart go to the very edge of the layout it’s inside. Currently it appears as though there is some default built-in padding around Pie Charts that cannot be overridden. I’ve tried manually specifying padding and margins both programmatically (on the SciChartSurface object itself) and in the layout XML, but that default padding still exists.
I’ve included a screenshot of the sample app to show the padding I’m talking about (circled in red).
- Kotula nkotula asked 5 years ago
- last active 5 years ago
Hi,
I’m trying to write an app which dynamically hides/shows (Visible/Gone) scichart surface without losing the data rendering. I’ve been trying to drive this via android visiblity and observable fields (MVVM design). An example of how our surfaces look is as follows:
<com.scichart.charting.visuals.SciChartSurface
android:id=”@+id/temperature_chart”
android:layout_width=”match_parent”
android:layout_height=”0dp”
android:layout_weight=”.99″
android:visibility=”@{graphViewModel.displayChartTemp ? View.VISIBLE : View.GONE}”
android:paddingTop=”@dimen/potrero_gap”
android:paddingBottom=”@dimen/potrero_gap”
scichart:verticalGroup=”@{graphViewModel.sharedVG}”
scichart:renderableSeries=”@{graphViewModel.tempRenderableSeries}”
scichart:xAxes=”@{graphViewModel.xTempAxes}”
scichart:yAxes=”@{graphViewModel.yTempAxes}”/>
and in the view model:
declaration:
var displayChartTemp = ObservableBoolean()
and to set the visibility….
displayChartTemp.set(true)
displayChartTemp.set(false)
I saw that historically, one solution was to
rsiChart.setRenderSurface(null);
rsiChart.setRenderSurface(new RenderSurfaceGL(getActivity()));
but I was wondering if there would be a good way to do this with MVVM architecture, and drive it similarly with observables?
Thanks,
-Andy
- Andrew Chin asked 5 years ago
- last active 5 years ago
I’m using the Trial version of your product.
If I buy the product, can I hide the banner?
- KIM HOONYOUNG asked 5 years ago
- last active 5 years ago
NativeScript tends to replace fragments rather than destroy the entire activity; so everything lives in a single activity. Unfortunately; when navigating pages the fragment might not be fully detached while the other one is being added (for animation purposes) and it throws this error:
Stacktrace
System.err: Attempt to invoke virtual method ‘void com.scichart.drawing.opengl.ao.a(int, int)’ on a null object reference
System.err:
System.err: StackTrace:
System.err: java.lang.NullPointerException: Attempt to invoke virtual method ‘void com.scichart.drawing.opengl.ao.a(int, int)’ on a null object reference
System.err: at com.scichart.drawing.opengl.aa.doFrame(SourceFile:88)
System.err: at android.view.Choreographer$CallbackRecord.run(Choreographer.java:909)
System.err: at android.view.Choreographer.doCallbacks(Choreographer.java:723)
System.err: at android.view.Choreographer.doFrame(Choreographer.java:655)
System.err: at android.view.Choreographer$FrameDisplayEventReceiver.run(Choreographer.java:897)
System.err: at android.os.Handler.handleCallback(Handler.java:790)
System.err: at android.os.Handler.dispatchMessage(Handler.java:99)
System.err: at android.os.Looper.loop(Looper.java:164)
System.err: at android.app.ActivityThread.main(ActivityThread.java:6494)
System.err: at java.lang.reflect.Method.invoke(Native Method)
System.err: at com.android.internal.os.RuntimeInit$MethodAndArgsCaller.run(RuntimeInit.java:438)
System.err: at com.android.internal.os.ZygoteInit.main(ZygoteInit.java:807)
I have tried using suspendUpdates on the surface to stop any updates; and finally went to where I have to manually remove it from the viewport before destruction occurs.
Is their any way to potentially catch this error and ignore it. It only happens during a destruction sequence that the SciChart doesn’t like. Or is their some way to stop all drawing so that it isn’t trying to call whatever is in SourceFile line 88
Also is their a better place to report stack traces for crashes?
- Nathanael Anderson asked 4 years ago
- last active 4 years ago
Hi,
I’d like to set line chart’s date xAxis ticks to be exactly one day apart in a way that where the label is shown, the time would be exactly 24:00.
I know I can set the minorDelta() and majorDelta(), but what value should I provide them? The minor tick when I zoom in should be 2 minutes and the major tick should be 24 hours.
- Erika Sankari asked 4 years ago
- last active 4 years ago
Hi,
I just downloaded SciChart for Android. Trying to get the Example to work.
I’ve put my trial key in SciChartApp.java and tried to run.
Here are the errors (screen shot attached).
Thank you,
Ed
- Ed Sykes asked 4 years ago
- last active 4 years ago
My chart is dynamic, adding data from the right side all the time, and scrolling the chart to the left. Now the chart can manually scroll to the right indefinitely, but there are many blank areas on the right side. What can I do to limit the range of scrolling to the right? Is there any way to limit the zoom ratio to prohibit the chart from scrolling to the right indefinitely?
- WU GUANGYU asked 3 years ago
- last active 3 years ago
When I work with the 2D Android Heatmap Chart, I want to draw a frame on the borders of the cells. Is this possible?
Thanks already for your help.
- MUSTAFA KELSAKA asked 3 years ago
- last active 3 years ago
I want to format my labels after tapping a radio button. But the major labels with the “dd mm” pattern and the minor labels with the “HH:mm” pattern. If I check the radio button in the radio button group the labels will format with the others formats. It works with TradeChartAxisLabelProvider but I can’t handle it with my own formats. What I have to use?
- Iliya Mashin asked 2 years ago
- last active 2 years ago
In the example code below, we attach two RenderableSeries to a single SciChartSurface.
The first RenderableSeries adds data from surface.suspendUpdates, and the second RenderableSeries adds data from setVisibleRangeChangeListener, which causes the chart to freeze.
The chart freezes even when I take actions such as using suspendUpdates in setVisibleRangeChangeListener, or adding data after performing a check such as Axis.isAttached.
However, if I run the code related to the dataSeries in the main thread, as shown in the code, the freezing goes away. Is this the correct way to perform changes to the dataSeries in the setVisibleRangeChangeListener?
import android.view.View
import com.scichart.charting.Direction2D
import com.scichart.charting.modifiers.AxisDragModifierBase
import com.scichart.charting.visuals.SciChartSurface
import com.scichart.charting.visuals.axes.AutoRange
import com.scichart.charting.visuals.axes.AxisAlignment
import com.scichart.charting.visuals.renderableSeries.FastCandlestickRenderableSeries
import com.scichart.core.model.DateValues
import com.scichart.core.model.DoubleValues
import com.scichart.data.model.DoubleRange
import com.scichart.examples.utils.scichartExtensions.OhlcDataSeries
import com.scichart.examples.utils.scichartExtensions.XyDataSeries
import com.scichart.examples.utils.scichartExtensions.categoryDateAxis
import com.scichart.examples.utils.scichartExtensions.chartModifiers
import com.scichart.examples.utils.scichartExtensions.fastColumnRenderableSeries
import com.scichart.examples.utils.scichartExtensions.numericAxis
import com.scichart.examples.utils.scichartExtensions.pinchZoomModifier
import com.scichart.examples.utils.scichartExtensions.renderableSeries
import com.scichart.examples.utils.scichartExtensions.rolloverModifier
import com.scichart.examples.utils.scichartExtensions.suspendUpdates
import com.scichart.examples.utils.scichartExtensions.xAxes
import com.scichart.examples.utils.scichartExtensions.xAxisDragModifier
import com.scichart.examples.utils.scichartExtensions.yAxes
import com.scichart.examples.utils.scichartExtensions.zoomPanModifier
import java.util.Date

fun initSampleCode(surface: SciChartSurface, ) {
surface.suspendUpdates {
    val ohlcDataSeries = OhlcDataSeries<Date, Double>()
    val ohlcRenderableSeries = FastCandlestickRenderableSeries().apply {
        dataSeries = ohlcDataSeries
    }
    val volumeDataSeries = XyDataSeries<Double, Double>("volume series")

    val sharedYRange = DoubleRange(0.0, 10.0)
    val volumeProfileXRange = DoubleRange(0.0, 10.0)

    renderableSeries {
        fastColumnRenderableSeries {
            dataSeries = volumeDataSeries
            xAxisId = "column-xAxis"
            yAxisId = "column-yAxis"

            dataPointWidth = 1.0
        }
        add(ohlcRenderableSeries)
    }

    xAxes {
        // 캔들
        categoryDateAxis {
//                axisId = "date-xAxis"
            cursorTextFormatting = "yyyy.MM"
            textFormatting = "yyyy.MM"

            setVisibleRangeChangeListener { axis, oldRange, newRange, isAnimate ->
                val columnYDoubleValues = DoubleValues()
                columnYDoubleValues.add(1.0)
                columnYDoubleValues.add(2.0)
                columnYDoubleValues.add(3.0)
                columnYDoubleValues.add(4.0)
                columnYDoubleValues.add(5.0)
                columnYDoubleValues.add(6.0)
                columnYDoubleValues.add(7.0)
                columnYDoubleValues.add(8.0)
                columnYDoubleValues.add(9.0)
                columnYDoubleValues.add(10.0)

                val columnXDoubleValues = DoubleValues()
                columnXDoubleValues.add(725_000.0)
                columnXDoubleValues.add(736_000.0)
                columnXDoubleValues.add(747_000.0)
                columnXDoubleValues.add(758_000.0)
                columnXDoubleValues.add(769_000.0)
                columnXDoubleValues.add(770_000.0)
                columnXDoubleValues.add(781_000.0)
                columnXDoubleValues.add(792_000.0)
                columnXDoubleValues.add(803_000.0)

                // !!CHART FREEZED!!
                volumeDataSeries.clear()
                volumeDataSeries.append(columnXDoubleValues, columnYDoubleValues)

                // NOT FREEZED
//                    CoroutineScope(Dispatchers.Main).launch {
//                        volumeDataSeries.clear()
//                        volumeDataSeries.append(columnXDoubleValues, columnYDoubleValues)
//                    }
            }
        }
        numericAxis {
            axisId = "column-xAxis"
            autoRange = AutoRange.Never
            axisAlignment = AxisAlignment.Right
            visibility = View.GONE

            this.flipCoordinates = true

            visibleRange = sharedYRange
        }
    }
    yAxes {
        numericAxis {
            // axisId = "price-yAxis"
            autoRange = AutoRange.Always
            growBy = DoubleRange(0.2, 0.2)
            cursorTextFormatting = "###,###"
            textFormatting = "###,###"

            visibleRange = sharedYRange
        }
        numericAxis {
            axisId = "column-yAxis"
            axisAlignment = AxisAlignment.Bottom
            // visibility = View.GONE

            visibleRange = volumeProfileXRange
        }
    }

    chartModifiers {
        xAxisDragModifier {
            receiveHandledEvents = true
            dragMode = AxisDragModifierBase.AxisDragMode.Pan
        }
        pinchZoomModifier {
            receiveHandledEvents = true
            direction = Direction2D.XDirection
        }
        zoomPanModifier {
            receiveHandledEvents = true
        }
        rolloverModifier()
    }

    val sampleDateValues = DateValues()
    sampleDateValues.add(
        arrayOf(
            Date(1388070000000),
            Date(1388156400000),
            Date(1388242800000),
            Date(1388329200000),
            Date(1388415600000),
            Date(1388502000000),
            Date(1388588400000),
            Date(1388674800000),
            Date(1388761200000),
        )
    )
    val sampleOpenValues = DoubleValues()
    sampleOpenValues.add(
        doubleArrayOf(
            737000.0,
            750000.0,
            750000.0,
            740000.0,
            768000.0,
            768000.0,
            776000.0,
            778000.0,
            831000.0,
        )
    )
    val sampleHighValues = DoubleValues()
    sampleHighValues.add(
        doubleArrayOf(
            755000.0,
            750000.0,
            750000.0,
            772000.0,
            800000.0,
            795000.0,
            788000.0,
            840000.0,
            846000.0
        )
    )
    val sampleLowValues = DoubleValues()
    sampleLowValues.add(
        doubleArrayOf(
            737000.0,
            750000.0,
            728000.0,
            740000.0,
            763000.0,
            765000.0,
            773000.0,
            774000.0,
            819000.0,
        )
    )
    val sampleCloseValues = DoubleValues()
    sampleCloseValues.add(
        doubleArrayOf(
            755000.0,
            750000.0,
            739000.0,
            768000.0,
            768000.0,
            777000.0,
            778000.0,
            834000.0,
            846000.0
        )
    )

    ohlcDataSeries.clear()
    ohlcDataSeries.append(sampleDateValues, sampleOpenValues, sampleHighValues, sampleLowValues, sampleCloseValues)
}
}
- JAIHOON PARK asked 3 months ago
- last active 3 months ago
