SciChart v2.0.0.2718 Beta 2!
SciChart v2.0 Beta 2 is here! This is the first public Beta after a private Beta to some of our customers. After a stabilisation period we will be going to full production release so please give us your feedback.
- Please read this Release Note with instructions on how to upgrade from v1.7
- For a breakdown of new features, please see this video.
- We have updated the live demo to show SciChart v2.0 here
- You can get the installed for SciChart v2.0 Beta 2 here
- You can view online Documentation which includes the class libraries plus some written articles. We will be adding to this collection over the coming weeks.
Finally, please give us your feedback on SciChart v2.0! If you require an extended trial key in order to view it, please contact us and we will gladly oblige.
New Features at a glance include:
- Box Plot, Error Bars, Bubble Chart, Fan Chart
- Heatmap / Spectrogram
- Stacked Column Chart, Stacked Bar Chart, Stacked Mountain Chart, Stacked Columns (side by side)
- No more DataSeriesSet, MVVM API improvements
- Unlimited, Multiple X-Axes
- Swap X-Y axis (rotate chart)
- New PointMarker API
- Support for more DataTypes in DataSeries (ushort, short, uint, byte, sbyte, TimeSpan)
- New TimeSpanAxis
- New Axis Interactivity API
- Alternative, Sub-pixel (High Quality) renderer
- High Performance Axis Bands, High Performance Dashed Line support (StrokeDashArray)
- Gradient Brush support for Column, Candlestick, Mountain, Box Plot and Stacked Chart types
- PaletteProvider now works on Line Series (Colors lines point by point)
- Support for custom themes via IThemeProvider
- Faster rendering in multiple axis scenarios
- Plugin renderer architecture
- Exceptions and renderer error codes – ‘Why didn’t SciChart render’ reason is output to Console
- Window
- New! online API documentation (work in progress)
- SciChart asked 11 years ago
Hi, Andrew. I want to change the style of the control handle of annotation, including color, size, shape and so on. Forthmore, I want to and a rotating handle, even the control handle of corner radius in BoxAnnotation. Could you give me some suggestions?
- wang siyuan asked 9 years ago
- last active 9 years ago
My UI works well using 3.1.
This is the second time I have tried to use 3.2.
In my first trial, my UI just crashed when use mouse.
using the latest build of 3.2, my ui has two issues:
1) UI response to mouse roll is not smooth sometimes!
2) Some element just gets disappeared while zooming. I have captured the following video. You can see that the RED circle gets disappeared while zooming out.
https://www.youtube.com/watch?v=1ClXAcMLOBU&feature=youtu.be
- chunxi asked 9 years ago
- last active 9 years ago
Hi,
I created a chart legend based on the online example. I have three data series: an XyScatterRenderableSeries, a FastColumnRenderableSeries, and a FastLineRenderableSeries. The plot itself is fine. But the legend isn’t. In addition to the checkboxes bug (I don’t need these and so have set ShowVisibilityCheckboxes=False, to no effect), I’m seeing color samples for the scatter and column data, but nothing for the line. All three series names appear as expected, but I’m missing the color sample for the line plot. What’s up?
Thanks,
–George
- yefchak asked 11 years ago
Hi,
I am trying to rotate a column chart exactly like the vertical chart example with one important distinction. I would like to have the values display bottom left (low) to top right (high) for both axes. I have price (x axis) on the left and volume (y axis) on the bottom. If I simply change AxisAlignment, I end up with price going from high (bottom) to low (top) and volume going from high (left) to low (right).
The Y axis (on the bottom due to the alignment) left to right goes from 100 to 0 instead of the desired 0 to 100. The same issue exists for the X axis.
- scott.boulette asked 8 years ago
- last active 8 years ago
How do I change the selection marker of an annotation? It seems to default to green squares of a certain size, which is all I can find in your examples. I tried to search the knowledgebase and forums but could not seem to find this answer. I would like to be able to control the color, shape, and size of the selection indicators for each annotation in my chart.
Thanks.
- Matt Machalinski asked 9 years ago
- last active 9 years ago
take the SciChart Trader as an example, x-Axis is type of CategoryDateTimeAxis. I want a way to show the index of the time in the collection, when mouse moves over the price bar in some mode like Rollover or Cursor.
regards
chunxi
- chunxi asked 9 years ago
- last active 9 years ago
Hi,
I observed a weird behavior with custom pointmarkers in SciChart. The issue is related to the previous one I reported, so I will not post my code snippets here, because it’s actually the same code as in the link. However, it is a different kind of issue, so I thought I should start a new thread.
Description (I attached a .gif to illustrate the issue):
Inside my RenderSurface, I have some pointmarkers which are filled with a transparent color and others which are filled with the color of the stroke of this pointmarker. Whether or not the pointmarker is filled depends on the IPointMetaData object attached to the point (and the meta data won’t change in any way).
When the chart gets displayed I have 4 pointmarkers visible. All 4 are filled, BUT only the leftmost SHOULD be filled. When I now scroll the chart to the right so that the leftmost pointmarker is not visible anymore the 3 remaining pointmarkers lose their fill and are now displayed as they should. Scrolling the first one back in the get filled again. I can only assume that this is maybe caused by SciChart cacheing some resources internally?
Important: I did only observe this issue with the Direct3D10RenderSurface. Everything works as expected with the other three surface types.
Edit:
seems like the gif animation does not work, so I added two more pictures.
DiaryPointMarker.cs
public class DiaryPointMarker : BasePointMarker
{
    private IList<IPointMetadata> _dataPointMetadata;
    IList<int> _dataPointIndexes = new List<int>();

    private readonly List<Point> _points = new List<Point>();

    public bool UseClustering { get; set; }
    public bool IndicateCommentWithFill { get; set; }

    private IPen2D _lowStrokePen;
    private IPen2D _midStrokePen;
    private IPen2D _highStrokePen;


    private IBrush2D _lowRatingColor;
    private IBrush2D _midRatingColor;
    private IBrush2D _highRatingColor;
    private IBrush2D _noCommentColor;

    public Brush LowRatingColor { get; set; }
    public Brush MidRatingColor { get; set; }
    public Brush HighRatingColor { get; set; }

    public override void BeginBatch(IRenderContext2D context, Color? strokeColor, Color? fillColor)
    {
        _dataPointMetadata = RenderableSeries.DataSeries.Metadata;

        _dataPointIndexes = new List<int>();
        _points.Clear();

        base.BeginBatch(context, strokeColor, fillColor);
    }


    public override void MoveTo(IRenderContext2D context, double x, double y, int index)
    {
        if (IsInBounds(x, y))
        {
            _dataPointIndexes.Add(index);
            _points.Add(new Point(x,y));
        }

        if (UseClustering)
        {
            base.MoveTo(context,x,y,index);
        }
    }

    public override void EndBatch(IRenderContext2D context)
    {
        if (UseClustering)
        {
            base.EndBatch(context);
        }
        else
        {
            Draw(context, _points);
            context.SetPrimitvesCachingEnabled(false);
        }
    }

    public override void Draw(IRenderContext2D context, IEnumerable<Point> centers)
    {
        TryCasheResources(context);

        var markerLocations = centers.ToArray();

        for (int i = 0; i < markerLocations.Length; ++i)
        {
            var diaryMetaInfo = _dataPointMetadata[_dataPointIndexes[i]] as DiaryPointMetaData;

            var center = markerLocations[i];

            var strokePen = diaryMetaInfo.Rating < 60
                ? _lowStrokePen
                : diaryMetaInfo.Rating < 80 ? _midStrokePen : _highStrokePen;
            var fillBrush = diaryMetaInfo.Rating < 60
                ? _lowRatingColor
                : diaryMetaInfo.Rating < 80 ? _midRatingColor : _highRatingColor;

            context.DrawEllipse(
                strokePen,
                IndicateCommentWithFill ? (String.IsNullOrEmpty(diaryMetaInfo.Comment) ? _noCommentColor : fillBrush) : fillBrush,
                center,
                Width,
                Height
                );
        }
    }

    private void TryCasheResources(IRenderContext2D context)
    {
        _lowStrokePen = _lowStrokePen ?? context.CreatePen(LowRatingColor.ExtractColor(), AntiAliasing, (float)StrokeThickness, Opacity);
        _midStrokePen = _midStrokePen ?? context.CreatePen(MidRatingColor.ExtractColor(), AntiAliasing, (float)StrokeThickness, Opacity);
        _highStrokePen = _highStrokePen ?? context.CreatePen(HighRatingColor.ExtractColor(), AntiAliasing, (float)StrokeThickness, Opacity);

        _lowRatingColor = _lowRatingColor ?? context.CreateBrush(LowRatingColor);
        _midRatingColor = _midRatingColor ?? context.CreateBrush(MidRatingColor);
        _highRatingColor = _highRatingColor ?? context.CreateBrush(HighRatingColor);
        _noCommentColor = _noCommentColor ?? context.CreateBrush(Color.FromArgb(0, 0, 0, 0));
    }
}
- Andreas Haas asked 8 years ago
- last active 8 years ago
Hi,
I’m having an exception thrown when I try to dynamically add an annotation. I’m using the example on your site as reference.I’m sure its something I’m overlooking. But I can’t figure out what it is. I have attached my code here, can you tell me what I’m doing wrong here. I’m trying to add a Line annotation when the user clicks on the context menu.
Thanks,
Deepak
- deepakb1 asked 10 years ago
Hi,
I’m looking to use the runtime editable lineannotation, I’ve set everything up and I can drag the line around with no problems. But, I couldn’t find a way to constraint the lineannotations’s movement, for example I only want the line annotation to be editable on the Y axis while the X values should be constant. Is there a way to do this? The HorizontalLineAnnotation seems to have this constraint but Horizontal and Vertical Line annotations always starts at zero, which is not what I’m going for.
Thanks
- kewur asked 9 years ago
- last active 9 years ago
I have some small chart to show trend data. It flickers when hovering cursor or zooming on it
- Xifeng Wen asked 10 years ago
Hello,
I do not seem to be able to have a scrolling Date/Time axis show seconds (or anything except hh:mm) regardless of what values I use for TextFormatting and SubDayTextFormatting.
Everything else works/displays as expected
My X axis XAML looks like:
<SciChart:SciChartSurface.XAxis>
<SciChart:CategoryDateTimeAxis TextFormatting=”MM/dd/yy” GrowBy=”0.1,0.1″ SubDayTextFormatting=”hh:mm:ss” AutoRange=”True” />
</SciChart:SciChartSurface.XAxis>
Many Thanks for your help
Mark
.NET 4.5, Win 7 SP1, VS2012
- Mark Attwood asked 11 years ago
Hi,
I would like to display simple equations as axis titles. For example cm^2 (with the 2 superscript) or g / mol with the “mol” under the g.
Is there a way to do that? At least being able to superscript or subscript any letter would be a must.
Thanks.
- xhahn asked 11 years ago
- last active 10 years ago
I want to align my left YAaxis labels to right and fixed label width. I use Spectrogram view and want to align the left edges of those charts. (I’m using version 4.0.2)
This is my style definition:
 <Style x:Key="LeftAxisLabelStyle" TargetType="s:DefaultTickLabel">
    <Setter Property="HorizontalAnchorPoint" Value="Right"/>
    <Setter Property="Width" Value="20"/>
 </Style>
but unfortunately it doesn’t work.
- Marek Sienczak asked 8 years ago
- last active 8 years ago
Hi All,
Can we give Black Border to Candles in Candle Stick chart.
- vinay khandelwal asked 9 years ago
- last active 9 years ago
Hi,
When we have 9 horizontal gridlines, we would also like to see 9 yvalues.
Is it possible to also show 300 and -500 on Yaxis1 and 500 and -300 on Yaxis2
(see attachment)
Thanks and best regards,
Egbert
- EJansen asked 10 years ago
Is there any documentation besides the tutorials? Something like the one found on MSDN, with all the Properties of the SciChart elements that can be styled.
- catalin asked 12 years ago
- last active 8 years ago
Hi,
I would like to ask if there is any easy way to select distict time intervals.
I have thought of creating vertical slices on mouse down and up events,
and highlighting the surface between the slices. Is there an easier way
to do this?
Thanks,
Chris
- Kristóf Czimer asked 8 years ago
- last active 8 years ago
Hi Support Team,
I am a SL developer and i am trying to save the scichart surface as a png file.
I have seen you example “First download the source code, you can find i.e. here: ScreenshotsXpsAndXLabels.zip”
but unfortunally it only works in Wpf , any suggestions would be appreciated.
Cheers
Giuseppe
- jp13 asked 11 years ago
Have you found a solution for the black flickering problem that occurs when you resize the form? The few solutions I’ve found online do not work. Good old Microsoft.
I may end up moving my app to WPF so I would assume this problem will just go away.
- David Adams asked 9 years ago
- last active 9 years ago
Now I am trying to add MVVM bindings for a Chart Legend
I have
        <SciChart:SciChartSurface x:Name="sciChart" DataSet="{Binding DataSeriesSet}"
            SciChart:ThemeManager.Theme="Oscilloscope"
            Grid.Row="1"
            RenderableSeries="{Binding RenderableSeries}"
            ChartModifier="{Binding ChartModifier}"
            XAxis="{Binding XAxis}"
            YAxes="{Binding YAxes}">
                   </SciChart:SciChartSurface>
        <SciChart:SciChartLegend x:Name="legendControl" Grid.Row="1" Margin="23,23" ShowVisibilityCheckboxes="True" LegendData="{ Binding LegendDataSource,  Mode=OneWay}"/>
and in My ViewModel
        public AnalogueChartViewModel()
        {
            XAxis = new DateTimeAxis
            {
                VisibleRange = RangeFactory.NewRange(DateTime.Now.AddDays(-2), DateTime.Now),
                DrawMinorGridLines = false,
                AxisTitle = "X-Axis"
            };
            RenderableSeries = new ObservableCollection<IRenderableSeries>();
            YAxes = new AxisCollection();
            DataSeriesSet = new DataSeriesSet<DateTime, double>();
            var xAxisDrag = new XAxisDragModifier();
            var zoomExtents = new ZoomExtentsModifier();
            var rubberBandZoom = new RubberBandXyZoomModifier();
            var panModifier = new ZoomPanModifier { ExecuteOn = ExecuteOn.MouseRightButton };
            _legendDataSource = new LegendModifier { GetLegendDataFor = 0 };

            ChartModifier = new ModifierGroup(xAxisDrag, zoomExtents, rubberBandZoom, panModifier, _legendDataSource);

        }

        private LegendModifier _legendDataSource;

        public LegendModifier LegendDataSource
        {
            get { return _legendDataSource; }
            set
            {
                _legendDataSource = value;
                OnPropertyChanged("LegendDataSource");
            }
        }
But not sure how to bind to the LegendData
Sorry I keep troubling you, but after all this there should be some good MVVM code for others to follow too.
- wilx asked 11 years ago
I have attached a picture showing what a depth track looks like (circled in red). The depth track takes the place of an X axis. In the picture the depth track is between a geology track above, and a normal log track below. Usually one depth track serves as the x axis for multiple plots, which are referred to as tracks.
I think that SciChart elements can be modified to produce this, but I am not sure where to start. Should I consider the depth track as just a plot with no curves and with the tick marks and x axis on the inside, or should I start with an independent x axis enclosed in a box?
- Stephen Painchaud asked 9 years ago
- last active 9 years ago
I have got a CustomTextAnnotation like in this example CustomTextAnnotation
I added a Rendertransform like this.
<s:TextAnnotation.RenderTransform>
    <RotateTransform Angle="90"/>
</s:TextAnnotation.RenderTransform>
But the AnchorPoint is not used as rotation center.
I thought of using ToCoordinate() but need a calculator for that which is not available within CustomTextAnnotation.
What is best practice to achive the requested rotation in sciChart?
- Bürger Martin asked 9 years ago
- last active 9 years ago
Hello,
I have a problem: I’m creating FastLineRenderableSeries with big StrokeThickness value. The bigger this value is the slower my program works.
Is there any way to speed it up in this situation?
P.S. I’ve attached project below.
Thanks in advance.
- Egor asked 8 years ago
- last active 8 years ago
Someone recently asked the question on priority support tickets
Q: How do I have two YAxis on the left and right of the chart but with
the same VisibleRange?
e.g. how to mirror the YAxis on both sides of the chart
We are replicating the answer below for benefit of our userbase:
- Andrew Burnett-Thompson asked 9 years ago
- last active 5 years ago
Hi,
I’m trying to set the Visible Range of a CategoryDateTime Axis and its throwing an “Object must be of type DateTime” exception. Can you tell me whats wrong here
var scs = new SciChartSurface();
scs.XAxis = new CategoryDateTimeAxis() { DrawMajorGridLines = false, DrawMinorGridLines = false,AutoRange=AutoRange.Never };
scs.YAxis = new NumericAxis() { Id = "Y1", DrawMajorGridLines = false, DrawMinorGridLines = false };
scs.Style = (System.Windows.Style)this.chartForm.sciChartControl.Resources["SciChartSurfaceStyle"];
DateTime startDate = new DateTime(2003, 9, 1);
DateTime endDate = new DateTime(2004, 1, 31);
scs.XAxis.VisibleRange = new DateRange(startDate, endDate);
The exception gets thrown on the last line. I also tried populating the series before I called the visible range, but it has not effect on the exception.
Thanks,
Deepak
- deepakb1 asked 10 years ago
Good day, everybody!
Recently I’ve upgraded my project to new SciChart version (v3.1.0.4761 (13th July 2014)). Previos version is 3.0.2.4282 (1st May 2014).
I noticed that the project had a lot of freezes. I watched output data and found out this:
A first chance exception of type 'System.InvalidOperationException' occurred in Abt.Controls.SciChart.Wpf.dll
A first chance exception of type 'System.InvalidOperationException' occurred in Abt.Controls.SciChart.Wpf.dll
 SciChartSurface didn't render, because an exception was thrown:
  Message: AxisCollection.GetAxisById('DefaultAxisId') returned more than one axis with the ID=DefaultAxisId. Please check you have assigned correct axis Ids when you have multiple axes in SciChart

  Stack Trace:    в Abt.Controls.SciChart.AxisCollection.GetAxisById(String axisId, Boolean assertAxisExists)
   в Abt.Controls.SciChart.Wpf.TreeNodeAttribute.JoinControl(ISciChartSurface firstFont, RenderPassInfo currentValues, IRenderContext2D currentId)
   в Abt.Controls.SciChart.Wpf.TreeNodeAttribute.RenderLoop(IRenderContext2D renderContext)
   в Abt.Controls.SciChart.Visuals.SciChartSurface.DoDrawingLoop()

A first chance exception of type 'System.InvalidOperationException' occurred in Abt.Controls.SciChart.Wpf.dll
A first chance exception of type 'System.InvalidOperationException' occurred in Abt.Controls.SciChart.Wpf.dll
 SciChartSurface didn't render, because an exception was thrown:
  Message: AxisCollection.GetAxisById('DefaultAxisId') returned more than one axis with the ID=DefaultAxisId. Please check you have assigned correct axis Ids when you have multiple axes in SciChart

  Stack Trace:    в Abt.Controls.SciChart.AxisCollection.GetAxisById(String axisId, Boolean assertAxisExists)
   в Abt.Controls.SciChart.Wpf.TreeNodeAttribute.JoinControl(ISciChartSurface firstFont, RenderPassInfo currentValues, IRenderContext2D currentId)
   в Abt.Controls.SciChart.Wpf.TreeNodeAttribute.RenderLoop(IRenderContext2D renderContext)
   в Abt.Controls.SciChart.Visuals.SciChartSurface.DoDrawingLoop()
How can I fix this error?
- Egor asked 10 years ago
- last active 10 years ago
Hello,
We would like to use SciChart to show data from a binary file (up to 1 GB!).
What would you suggest as the best method for achieving this?
Thanks
Zoe
More details:
The binary file contains for example the following data: a1b1c1a2b2c2a3b3c3…
where a1 b1 c1 etc are double byte numbers.
In the chart we would like to show 3 series:
serie a: (1,a1) (2, a2) (3,a3) etc
serie b: (1,b1) (2, b2) (3,b3) etc
serie c: (1,c1) (2, c2) (3,c3) etc
Hope this is clear…
- zoe asked 11 years ago
Hi,
How can I get my application to do the following:
- RubberBandXyZoomModifier execute on left mouse
- ZoomPanModifier execute on left mouse + ctrl
I tried extending the ZoomPanModifier as such:
public class ZoomPanModifierEx : ZoomPanModifier
{
   public override void OnModifierMouseDown(ModifierMouseArgs e)
   {
      IsEnabled = (e.MouseButtons == MouseButtons.Left) && (e.Modifier == MouseModifier.Ctrl);
      base.OnModifierMouseDown(e);
   }
}
This did not work though.
Thanks in advance.
Johnny
- johnnyp112 asked 11 years ago
Why I can’t access to the TooltipContainerStyle property in RolloverModifier in SciChart v4.0?
I’ve read documentation and it seems that it should work but it doesn’t ;(
Does it any other way to change the tooltip label in RolloverModifier?
- Marek Sienczak asked 8 years ago
I wanted to show a histogram with normal distribution.
But I used FastColumnSeries and plotted histogram.
Example codes doesnt contain histogram plot. Can anybody tell how to calculate normal distribution line for histogram
Here is the link on how to draw a normal distribution line for histogram http://www.theinformationlab.co.uk/2013/11/04/fitting-a-gaussian-normal-distribution-curve-to-a-histogram-in-tableau/
- Anitha Chanumolu asked 9 years ago
- last active 9 years ago
Hi,
Can you tell me if it is possible to make a contour plot like on the image i have attached?
I cant seem to find a way to do that.
Best regards,
Jeppe
- Unisense A/S Tueager asked 10 years ago
Hi Guys,
My Sci Chart has dates along the X-Axis. So far my data is at week level (one point for each week).
Ideally I would like to have a subtle grid line at each week, a more noticeable grid line to represent the start of each month, and a major grid line to represent the start of each year.
I understand that the current implementation of the XAxis seems to only use Minor and Major gridlines.
I am interested in drawing grid lines such that:
one minor vertical grid-line is drawn on the start of each week
one medium vertical grid-line is drawn on the start of each month
one major vertical grid-line is drawn on the start of each year
And for these grid lines to be drawn regardless of the current visible range or “zoom” of the chart.
Is there a simple tutorial or some snippet of code illustrating what I need to overwrite in a custom class in order to get this functionality into my chart?
Thanks again,
Miles
- bstapylton asked 12 years ago
I am using the CursorModifier to draw a custom tooltip that has information for all of the series on it. However, the user has asked that the point that is drawn on the series be made more visible by making it larger and red. How do I go about doing that? I’ve seen examples for rollover marker and point marker customization, but can’t find anything for the cursor marker.
Thanks
- sdamge asked 8 years ago
- last active 8 years ago
The default appearance for the vertical line annotation is for the series name and Y value to be displayed next to the data point. Is it possible to move this display elsewhere? On sine wave type data it doesn’t work so good because the text box moves up and down so much as the user scrolls the line annotation. Even just putting it at the bottom of the chart right above the X axis would be a huge improvement.
I assume this is a ControlTemplate modification type issue but I don’t know where to start looking.
- David Adams asked 9 years ago
- last active 9 years ago
Hey guys,
I am setting the GridLinesPanelStyle property of my SciChartSurface to the following Style from the Resources of the parent Border element:
<Style x:Key="GridLinesPanelStyle" TargetType="{x:Type axes:GridLinesPanel}">
    <Setter Property="KeyboardNavigation.ControlTabNavigation" Value="None" />
    <Setter Property="IsTabStop" Value="False" />
    <Setter Property="Background" Value="Transparent" />
    <Setter Property="BorderBrush" Value="{StaticResource ChartBorderBrush}" />
</Style>
When snooping down into the “PART_GridLinesArea” I see that the Background is set to #FF353535 from the “Parent Template”. It gets interesting; I can Delve into the Style property of the same element and see my setters from the above snippet of code.
This approach was working pre-SciChart 2.0 and it appears to be the approach being used by the Examples suite as well, but I can’t yet get that running with my licence (there is another thread asking for help to fix this too ;)!).
Thanks for your support,
Miles
- bstapylton asked 11 years ago
Hi all,
I have a IChartSeriesViewModel with the FastLineRenderableSeries. When I dynammically change it to the
FastMountainRenderableSeries, the scichart doesn’t update surface.
private static IChartSeriesViewModel Build(IChartSeriesViewModel seriesViewModel,
IDataSeries series,
IRenderableSeries newRenderSeries)
{
// Create viewmodel instance for the created chart.
if (seriesViewModel == null)
seriesViewModel = new ChartSeriesViewModel(series, newRenderSeries);
seriesViewModel.RenderSeries = newRenderSeries;
seriesViewModel.DataSeries = series;
return seriesViewModel;
}
What can I salve it?
Many thanks,
Arhur.
- Arthur Romanov asked 10 years ago
Is there any way I can store and later access an object (enum, string,…) to/from RenderableSeries?
- bbmat asked 9 years ago
- last active 9 years ago
Hi guys,
I’ve noticed that in my application, the Rollover Modifier vertical line is rendering off-center compared to gridlines. I stack a couple of SciCharts on top of each other and they both utilise the Rollover. This is causing a funny look. Please see the attached screenshot for more info.
It also appears that the RolloverMarker is also rendering a little off-center with reference to the gridlines and the datapoints. I’ve attached a screenshot from the SciChart Examples for this one.
- bstapylton asked 11 years ago
Hi
i use scichart in a usercontrol which can be added by a button to the mainwindow. With a contextmenu i change a property in my ViewModel of the usercontrol.
<UserControl.ContextMenu >
<ContextMenu >
<MenuItem Header="Style">
<ComboBox ItemsSource="{Binding Path=ChartStyleList}" SelectedItem="{Binding Path=SelectedChartStyle}">
</ComboBox>
</MenuItem>
</ContextMenu>
</UserControl.ContextMenu>
this property is also bound to the thememanager property in the xaml code.
<my:SciChartSurface HorizontalAlignment="Stretch" Name="Chart" VerticalAlignment="Stretch" sciChart:ThemeManager.Theme="{Binding Path=SelectedChartStyle}" >
The problem is now that when i change the property of one Usercontrol and so the theme of one scichart the others scicharts also change there theme.
Is this an error in my code or is this supposed to happen?
- Jan Eckhardt asked 10 years ago
I have a ViewModel class with three controls, two text boxes and a checkbox. The two text boxes are supposed to control minimum and maximum of the chart, and the autoscale should set the AutoRange of the chart.
I’ve got my XAML like this
<sc:SciChartSurface.YAxis>
<sc:NumericAxis AxisTitle="PSD" MaxAutoTicks="5" DrawMinorGridLines="False" AutoRange="{Binding AutoScale}" VisibleRange="{Binding YVisibleRange}">
</sc:NumericAxis>
</sc:SciChartSurface.YAxis>
and in my viewmodel, I have:
    public int Maximum
    {
        get { return _maximum; }
        set
        {
            _maximum = value;
            NotifyOfPropertyChange(() => Maximum);
            YVisibleRange.Max = _maximum;
        }
    }


    public int Minimum
    {
        get { return _minimum; }
        set
        {
            _minimum = value;
            NotifyOfPropertyChange(() => Minimum);
            YVisibleRange.Min = _minimum;
        }
    }

    public DoubleRange YVisibleRange
    {
        get { return _visibleRange; }
        set
        {
            _visibleRange = value;
            NotifyOfPropertyChange(() => YVisibleRange);
        }
    }


    public void ToggleAutoScale()
    {
        AutoScale = !AutoScale;
    }

    public bool AutoScale
    {
        get { return _autoScale; }
        set
        {
            _autoScale = value;
            NotifyOfPropertyChange(() => AutoScale);
        }
    }
The auto scale functionality always works. However, only when I have not used auto scale at all, does the minimum maximum stuff work.
I would like for auto scale to completely control the graph when it’s on, and when it’s off, minimum/maximum should control the range of the graph. How do I achieve this?
- Kasper Hansen asked 11 years ago
Hi,
I’m using MVVM to dynamically add axes in the runtime with a binding to YAxes and XAxes from the SciChartSurface. like this,
<s:SciChartSurface XAxes="{Binding XAxes}" YAxes="{Binding YAxes}"/>
The problem is, since I’m creating and adding these from the ViewModel, my “AxisStyle” style (defined inside UserControl.Resources) does not automatically apply to my axes. Initially I had the style in my Resources file, which I can access from the ViewModel and manually apply it from the code.
The reason I’m changing the style’s location from Resources.xaml to the control itself is this;
 <Style x:Key="AxisStyle" TargetType="SciChart:AxisBase">
            <Setter Property="TickTextBrush" Value="{Binding GraphThemeOptions.LabelBrush}"/>
            <Setter Property="MinorTickLineStyle">
                <Setter.Value>
                    <Style TargetType="Line">
                        <Setter Property="Stroke" Value="{Binding GraphThemeOptions.LabelBrush"/>
                    </Style>
                </Setter.Value>
            </Setter>
  </Style>
I can use a proxy binding to pass the datacontext to the MinorTickLineStyle style, but only in the UserControl itself, not an external resource dictionary.
I was hoping to do something like this:
<s:SciChartSurface>
      <SciChartSurface.XAxes ItemsSource="{Binding XAxes"} Style="{StaticResource AxisStyle}"/>
</s:SciChartSurface>
But XAxes does not have any properties I can access from XAML.
What would be a good way to apply a style from XAML and still have dynamic Axes.
Thank you,
- kewur asked 9 years ago
- last active 9 years ago
i have a problem with zoom : i can’t declare my function for charting inside the constructor of my class no also in the function loaded for the simple reason because i must pass two list for this function “public void CreateDataSetAndSeries(List lstX, List lstY)”, so, i create my function like this in my .XAM.cs class :
public void CreateDataSetAndSeries(List lstX, List lstY)
{
series0 = new XyDataSeries<DateTime, double>();
        using (this.sciChartSurface.SuspendUpdates())
        {

               series0.Append(lstX, lstY);

        }
        lineSeries.DataSeries = series0;
        sciChartSurface.ZoomExtentsY();
   }
and for my class.xaml i write this :
<SciChart:SciChartSurface.ChartModifier>
<SciChart:RubberBandXyZoomModifier/>
                <SciChart:ZoomPanModifier ExecuteOn="MouseRightButton"/>
                    <SciChart:ZoomExtentsModifier ExecuteOn="MouseDoubleClick"/>

                <SciChart:CursorModifier ReceiveHandledEvents="True" ShowAxisLabels="True"  ShowTooltip="True" ShowTooltipOn="MouseRightButtonDown"/>
the problem i can’t did the zoom So what i can do ?
waiting for your response thank you !
- sahar Les asked 9 years ago
- last active 9 years ago
Hi,
I’m having difficulties understanding the behaviour of a graph with the following axes:
<s:SciChartSurface.XAxis>
                            <s:LogarithmicNumericAxis DrawMajorBands="False"
                                                      LogarithmicBase="10"
                                                      VisibleRange="0.01,5"
                                                      DrawMinorGridLines="False"
                                                      DrawMajorGridLines="False">
                            </s:LogarithmicNumericAxis>
                        </s:SciChartSurface.XAxis>


                        <s:SciChartSurface.YAxis>
                            <s:NumericAxis  DrawMinorGridLines="False"
                                            DrawMajorGridLines="False"
                                            AxisAlignment="Left"
                                            VisibleRange="{Binding FftDroiteGaucheYAxisRange, UpdateSourceTrigger=PropertyChanged}"/>
                        </s:SciChartSurface.YAxis>
With XAxis VisibleRange set to “0.01,5” the graph looks like this:
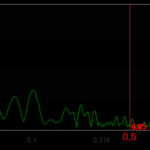
When I change it to a bigger range say “0.01,11” or more FOR THE SAME DATA it gets deformed and looks like:
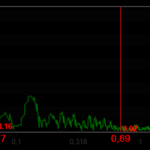
I tried removing VisibleRange in YAXis but it doesn’t seem to work. Please help.
- Kilosa Magali asked 8 years ago
- last active 8 years ago
Hi,
My step line chart represents a real-time time series and the viewport slides forwards in realtime to show the last 5 minutes. Sometimes the value of the series doesn’t change for some seconds or minutes. This leaves a gap in the line chart between the latest value and the right side of the viewport (now).
I would like the latest value to always be extended as a horizontal line to meet the right side of the viewport.
I have half achieved this by extending FastLineRenderableSeries like so:
public class ExtendRightFastLineRenderableSeries : FastLineRenderableSeries
{
    protected override void InternalDraw(IRenderContext2D renderContext, IRenderPassData renderPassData)
    {
        base.InternalDraw(renderContext, renderPassData);

        var points = renderPassData.PointSeries;

        var yLast = renderPassData.YCoordinateCalculator.GetCoordinate(points.YValues.Last());

        var xLast = renderPassData.XCoordinateCalculator.GetCoordinate(points.XValues.Last());
        var xEnd = renderContext.ViewportSize.Width;

        using (var linePen = renderContext.CreatePen(this.SeriesColor, this.AntiAliasing, this.StrokeThickness))
        {
            using (var lineDrawingContext = renderContext.BeginLine(linePen, xLast, yLast))
            {
                lineDrawingContext.MoveTo(xEnd, yLast);
            }
        }
    }
}
The only problem is that when no data points are in the viewport (because the value last changed more than 5 minutes ago) then the Draw method of the FastLineRenderableSeries never gets called.
How can I force the redraw even though there are no points in the viewport. Alternatively, is there a better way to approach this?
Cheers
Felix
- F W asked 9 years ago
- last active 9 years ago
I want to change the visibility of annotations in .cs file
MyLine.Visibility = System.Windows.Visibility.Hidden;
where MyLine is an annotation
s:LineArrowAnnotation x:Name=”MyLine” X1=”1″ Y1=”0″ X2=”1000″ Y2=”0″ Stroke=”Black” StrokeThickness=”1″ Visibility=”Visible” StrokeDashArray=”10,5″
However even after changing it to hidden the line still displays,
Any suggestions are appreciated..
PS: I am able to modify the location with no problem at all..
- manish Bhardwaj asked 10 years ago
- last active 10 years ago
Hello,
is it possible to display the series name of the series used for the overview chart? In this special case, i have a chart containing many series and it should be configurable which one is selected for the overview chart. The problem is, on the overview chart it is not easily visible which series is displayed, especially if zoomed in.
My last-resort solution would be to place the name of the series over the overview chart manually, but maybe you know a more elegant solution
Thanks,
Robin
- Andreas Mueller-Bluemlein asked 11 years ago
- last active 9 years ago
A useful addition to the OhlcDataSeries would be an Append(datetime,value) method that would automatically determine whether to update the latest open, high, low, close or add a new bar based based on the values passed in, the current bar time/values and the BarTimeFrame property.
Thanks again
Paul
- murfinp asked 11 years ago
Hello,
I would like to allow user click on Legend and highlight the corresponding Series on the chart but I don’t know if this feature is supported or not.
I tried to add mouse events to the Legend Modified but it seems like mouse events are not triggered
This is the simple code that I am using
<s:LegendModifier x:Name="chlLegend" ShowLegend="True" LegendPlacement="Top" Orientation="Horizontal" MouseDown="chlLegend_MouseDown" ScrollViewer.HorizontalScrollBarVisibility="Auto" />
Before investigating more I would like to ask you if you have any hints which is the correct way to implement this behavior.
Is the LegendModifier suitable for this or should I override instead the Legend Control Template?
Thank you in advance for the support
- Marco Ragogna asked 8 years ago
- last active 8 years ago
I am considering applying server-side licensing for my javerScript application.
In the document below, there is a phrase “Our server-side licensing component is written in C++.”
(https://support.scichart.com/index.php?/Knowledgebase/Article/View/17256/42/)
However, there is only asp.net sample code on the provided github.
(https://github.com/ABTSoftware/SciChart.JS.Examples/tree/master/Sandbox/demo-dotnet-server-licensing)
I wonder if there is a sample code implemented in C++ for server-side licensing.
Can you provide c++ sample code?
Also, are there any examples to run on Ubuntu?
- Daniel Nyvik asked 9 years ago
