i have been working on line charts and i need to show date as well as time on the axis( 21 june 08 05:30:PM like this).I’ve tried with date axis and numeric axis ,but it doesn’t helps.Do we have any suggestions or samples which could help me
- Vinu Gilbert asked 3 years ago
- last active 3 years ago
I would like to add scroll listener on x axis title. Is it possible to add scroll to axis title
- Vinu Gilbert asked 3 years ago
- last active 3 years ago
Hi
Sometimes when I call annotation.setIsHidden in a surface with RenderSurfaceGl, not works.
what should I do?
- abolfazl ghanbari asked 3 years ago
I want to make my labels positions in the centre of axis (y axis which is transparent). Only three labels have to be showed. On the same height with the min, max and actual points. How can I achieve this.

- Iliya Mashin asked 2 years ago
- last active 2 years ago
Hello Friends,
I'm looking a solution where i can change Y-Axis range in between (0.1,0.2,0.4,0.6,0.8,1.0) .
I appreciate any help for above question
Thanks
Vasim
- vasim simform asked 3 years ago
- last active 3 years ago
Hello Friends ,
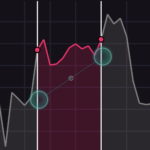
Sync two Chart in Android Bottom chart can be change on top chart touch
We are looking a solution where we want show two chart at Top and Bottom in Android Screen.based on Top chart changed by gesture /finger touch should be expend/shrink like zoom in and out bottom chart
Assume at top chart data range has between 0 to 3,00,000 , I want to capture in bottom chart only selected/touched part in with expanded form.
I have attached below screen shot which may be helpful.
Solution can be like this but not able to get code for this implementation
https://blog.scichart.com/content/images/2021/06/Navigate-ECG-strip-with-Pocket-ECM.gif
https://blog.scichart.com/android-app-to-view-long-term-ecg-signals/
I appreciate any help regarding this issue.
- vasim simform asked 3 years ago
- last active 2 years ago
Hello,
At right chart we have show only one X-axis which needs to update in real time .whenever new values will come we have to update in X-axis in itself instead of adding new line at X-Axis.
Each time New Y – axis will come that will append at left chart (Can be consider left chart showing history of right chart)
Let me know if anything further requred
Thanks.
- vasim simform asked 3 years ago
- last active 3 years ago
I’m seeing a crash log that happens only some times (it’s not consistently reproducible) that looks like this:
libc F FORTIFY: pthread_mutex_lock called on a destroyed mutex

libc F Fatal signal 6 (SIGABRT), code -1 (SI_QUEUE) in tid 10371 (GLThread), pid 9832

DEBUG F #00 pc 00000000000531f4 /apex/com.android.runtime/lib64/bionic/libc.so (abort+164) (BuildId: dc4001c2ef2dfc23467040797a96840c)

F #01 pc 000000000005507c /apex/com.android.runtime/lib64/bionic/libc.so (__fortify_fatal(char const*, ...)+124) (BuildId: dc4001c2ef2dfc23467040797a96840c)

F #02 pc 00000000000c360c /apex/com.android.runtime/lib64/bionic/libc.so (HandleUsingDestroyedMutex(pthread_mutex_t*, char const*)+60) (BuildId: dc4001c2ef2dfc23467040797a96840c)

F #03 pc 00000000000c34a0 /apex/com.android.runtime/lib64/bionic/libc.so (pthread_mutex_lock+208) (BuildId: dc4001c2ef2dfc23467040797a96840c)

F #04 pc 0000000000833ac8 /vendor/lib64/egl/libGLES_mali.so (eglp_try_display_finish_terminating+88) (BuildId: 556d636a49f8475a)

F #05 pc 000000000083f268 /vendor/lib64/egl/libGLES_mali.so (eglp_release_tls+232) (BuildId: 556d636a49f8475a)

F #06 pc 00000000000c2c8c /apex/com.android.runtime/lib64/bionic/libc.so (pthread_key_clean_all()+124) (BuildId: dc4001c2ef2dfc23467040797a96840c)

F #07 pc 00000000000c2408 /apex/com.android.runtime/lib64/bionic/libc.so (pthread_exit+72) (BuildId: dc4001c2ef2dfc23467040797a96840c)

F #08 pc 00000000000c2270 /apex/com.android.runtime/lib64/bionic/libc.so (__pthread_start(void*)+208) (BuildId: dc4001c2ef2dfc23467040797a96840c)

F #09 pc 0000000000054a30 /apex/com.android.runtime/lib64/bionic/libc.so (__start_thread+64) (BuildId: dc4001c2ef2dfc23467040797a96840c)
Any idea what could be happening?
- Marcela Guerra asked 1 year ago
Hi
I want to access the SciTrader application source so that I can implement the features I need by checking it.
Please guide me to access this source code
- Vahid Garousi asked 1 year ago
- last active 1 year ago
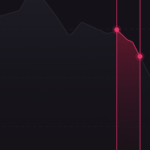
In financial markets, there is a type of chart that is as follows.
I did not find this type of chart in SciChart.
Please help me how to draw this chart
- Vahid Garousi asked 1 year ago
- last active 1 year ago
Hello! How i can create same style on select chart
i use public class XyCustomPaletteProvider extends PaletteProviderBase<XyRenderableSeriesBase> implements IFillPaletteProvider, IStrokePaletteProvider, IPointMarkerPaletteProvider { but i can pass only single color like this:
I try create three AreaStyle with gradient but nothing could be done…
use version SciChart 4.4.0.4739
- Sergey Evdokimov asked 1 year ago
- last active 1 year ago
Hello! I am try to create chart with axis on top in my react native app, chart is create succesfuly, but when I start add annotation – it shift to top by axis height – whats may be wrong?
`
// create
surface = new CSciChartSurface(context);
surface.setRenderSurface(new RenderSurface(context));

// Initialize the SciChartBuilder
SciChartBuilder.init(context);

// Obtain the SciChartBuilder instance
sciChartBuilder = SciChartBuilder.instance();

 xAxis = sciChartBuilder
      .newCategoryDateAxis()
      .withTextFormatting(DateChartFormatter.defaultDateFormat)
      .withGrowBy(0.0d, 0.04d)
      .withDrawMajorGridLines(true)
      .withDrawMinorGridLines(false)
      .withDrawMajorBands(false)
      .withDrawMajorTicks(false)
      .withAxisAlignment(AxisAlignment.Top)
      .build();
// same yaxis and any

VerticalLineAnnotation verticalLine = sciChartBuilder.newVerticalLineAnnotation()
        .withPosition(10, 16)
        .withStroke(2, ColorUtil.Orange)
        .withIsEditable(true)
        .build();

Collections.addAll(surface.getYAxes(), yAxis);
Collections.addAll(surface.getXAxes(), xAxis);
Collections.addAll(surface.getRenderableSeries(), lineRenderableSeries);
Collections.addAll(surface.getAnnotations(), verticalLine);

// add to view
this.addView(surface);
`
- Sergey Evdokimov asked 1 year ago
- last active 1 year ago
Hello! I want to create an AxisMarkerAnnotation but the padding doesn’t match the position of the text on the axis – I would like to align it and what is the way to do it? couldn’t find the right settings
- Sergey Evdokimov asked 12 months ago
- last active 12 months ago
Hello there,
I am testing your 3d chart in demo project but I added X,Y and Z data, also added tool-tip to check the value
final TooltipModifier3D tooltipModifier3D = new TooltipModifier3D();
tooltipModifier3D.setIsEnabled(true);
tooltipModifier3D.setMarkerPlacement(Placement.TopRight);
tooltipModifier3D.setExecuteOnPointerCount(1);
tooltipModifier3D.setCrosshairMode(CrosshairMode.Lines);
surfaceCommon3D.getChartModifiers().add(tooltipModifier3D);
And also implement custom tool-tip UI.
The Issues is when I hover cursor on chart it not showing exact position on tool-tip. I attach SS png you can check it,
SS showing my cursor is on position x=6 but on tooltip it showing x=2.Waiting for your reply.
Thanks You
- Amir Khan asked 2 years ago
Hello there,
I am testing your 3D chart by creating single chart and adding multi data on condition.Whenever adding new data I clear previous.
surfaceCommon3D.getRenderableSeries().clear();
surfaceCommon3D.getChartModifiers().clear();
Issues is when first data add tooltip working properly and after adding new data then checking tooltip value Application will crash and show this error:
java.lang.ArrayIndexOutOfBoundsException: index
at com.scichart.core.model.DoubleValues.get(SourceFile:6)
at com.scichart.charting3d.visuals.renderableSeries.hitTest.MeshSeriesInfo3D.update(SourceFile:10)
here is my tooltip snippet code:
TooltipModifier3D t1 = new TooltipModifier3D();
t1.setReceiveHandledEvents(true);
t1.setExecuteOnPointerCount(1);
surfaceCommon3D.getChartModifiers().add(new ModifierGroup3D(t1));
SurfaceMeshRenderableSeries3D snippet code:
rs = sciChart3DBuilder.newSurfaceMeshSeries3D()
.withDataSeries(ds)
.withDrawMeshAs(DrawMeshAs.SolidWireframe)
.withStroke(blackColor)
.withContourStroke(stroke)
.withStrokeThicknes(1f)
.withDrawSkirt(false)
.withMeshColorPalette(new GradientColorPalette(colors, stops))
.withMetadataProvider(new SurfaceMeshMetadataProvider3D(pnl_time_spot_Z_3d, xSize, “common3DChartLayout”))
.withSeriesInfoProvider(new CustomSeriesInfo3DProvider1(fromModel, xSize))
.build();
UpdateSuspender.using(surfaceCommon3D, new Runnable() {
@Override
public void run() {
surfaceCommon3D.setCamera(camera);
surfaceCommon3D.setXAxis(xAxis);
surfaceCommon3D.setYAxis(yAxis);
surfaceCommon3D.setZAxis(zAxis);
surfaceCommon3D.getRenderableSeries().add(rs);
surfaceCommon3D.invalidate();
}
});
I am Requesting you to solved my issues ASAP.
Thanks in Advance
- Amir Khan asked 2 years ago
I am using the examples app for Android and I am noticing that sometimes in the Line Chart example the background colour changes to black instead of the standard grey colour. Seems to be a random occurrence. I am currently testing on a Nexus 7 running 4.4.2. The problem doesn’t occur on my Nexus 4 running 5.1.1.
Thank you,
Andrew
- andrew tiernay asked 8 years ago
- last active 8 years ago
I was wondering about the possibilities to show markers. I dug a while in the examples and played with default interactions, which use dragging to update the position of the marker.
On mobile devices this conflicts a little with the pan interaction to move the chart. I saw there’s also the possibility to pan using the axes area. There’s also the possibility to just tap on the chart, which doesn’t conflict with other interactions, to show a marker, but I couldn’t find how to do this. At least there doesn’t seem to be built in support for it? How should this be done?
Additionally I would like once a marker appears to either be able to update only by tapping again at other place on the chart (simple solution) or temporarily disabling the panning such that this gesture only moves the marker and not the chart (preferred, but probably less simple solution). So tapping on the chart would enter “marker mode” which disables zooming and panning and some other gesture – e.g. using an external button on the chart, would leave “marker mode” and enter zoom/pan mode again.
Any ideas how to achieve this? Thanks in advance!
P.S. I’m also using a real time chart, though this probably doesn’t make a difference concerning this.
- Ivan Schütz asked 7 years ago
- last active 7 years ago
Hi,
I’m working on the iOS and android version. I’m trying to implemented an animated visible range change on Y axis when zooming/panning X axis.
On iOS, I just have to do:
yAxis.autoRange = .always
yAxis.animateVisibleRangeChanges = true
yAxis.animatedChangeDuration = 0.5
But I can’t find a way to do that on Android, is it hidden somewhere else?
Kind Regards,
Alexis
- Alexis Durand asked 6 years ago
- last active 6 years ago
issue resolved….it happened due to late initialization of super class instance for context.
- Praween Kumar asked 5 years ago
- last active 5 years ago

I have 3 separate line series and 1 column bar series. Whenever I switch between activities, Column bar data and range persist but not for the line series.
Whenever I return back from activityB to ActivityA it never calls restoreInstanceState. How can I persist the states of these graph?
Snap short attached for reference.
—–code,
initChartUI() {
    SciChartBuilder.init(mContext)
    sciChartBuilder = SciChartBuilder.instance()

    xyIapDataSeries =
            sciChartBuilder.newXyDataSeries(Date::class.javaObjectType, Short::class.javaObjectType)
                .withSeriesName(getString(R.string.label_iap)).build()

    xyTempDataSeries =
            sciChartBuilder.newXyDataSeries(Date::class.javaObjectType, Short::class.javaObjectType)
                .withSeriesName(getString(R.string.label_temperature)).build()

    xyUoDataSeries =
            sciChartBuilder.newXyDataSeries(Date::class.javaObjectType, Short::class.javaObjectType)
                .withSeriesName(getString(R.string.label_uo)).build()

    xyRrDataSeries =
            sciChartBuilder.newXyDataSeries(Date::class.javaObjectType, Short::class.javaObjectType)
                .withSeriesName(getString(R.string.label_respiratory_rate)).build()

    initChartIap(iap_chart)
    initChartUo(uo_chart)
    initChartTemp(temperature_chart)
    initChartRR(resp_rate_chart)
}
private fun initChartIap(surface: SciChartSurface) {
val xAxis = sciChartBuilder.newCategoryDateAxis()
.withBarTimeFrame(SECONDS_IN_FIVE_MINUTES.toDouble())
.withDrawMinorGridLines(false)
.withGrowBy(0.0, 0.5)
.build()
val yAxis = sciChartBuilder.newNumericAxis().withAutoRangeMode(AutoRange.Always).build()
    val line = sciChartBuilder.newLineSeries().withStrokeStyle(R.color.accuryn_blue, STROKE_THICKNESS)
        .withDataSeries(xyIapDataSeries).build()

    // Create a Stroke Pen and assign it
    val strokePen = SolidPenStyle(resources.getColor(R.color.accuryn_blue, null), true, 2f, null)
    line.strokeStyle = strokePen

    UpdateSuspender.using(surface) {
        Collections.addAll(surface.xAxes, xAxis)
        Collections.addAll(surface.yAxes, yAxis)
        Collections.addAll<BaseRenderableSeries>(surface.renderableSeries, line)
        Collections.addAll<AxisMarkerAnnotation>(surface.annotations, iapAxisMarker)
        Collections.addAll(
            surface.chartModifiers, sciChartBuilder.newModifierGroup()
                .withXAxisDragModifier().build()
                .withZoomPanModifier().withReceiveHandledEvents(true).withXyDirection(Direction2D.XDirection).build()
                .withPinchZoomModifier().build()
                .build()
        )
    }
……
rest 3 other types….
…..
override fun onSaveInstanceState(outState: Bundle) {
    outState.run {
        putInt("count", xyIapDataSeries.count)
        putInt("uoCount", xyUoDataSeries.count)
        putInt("tempCount", xyTempDataSeries.count)
        putInt("rrCount", xyRrDataSeries.count)

        val iapRange = iap_chart.xAxes[0].visibleRange
        val uoRange = uo_chart.xAxes[0].visibleRange
        val tempRange = temperature_chart.xAxes[0].visibleRange
        val rrRange = resp_rate_chart.xAxes[0].visibleRange

        putDouble("rangeIapMin", iapRange.getMinAsDouble())
        putDouble("rangeIapMax", iapRange.getMaxAsDouble())
        putDouble("rangeUoMin", uoRange.getMinAsDouble())
        putDouble("rangeUoMax", uoRange.getMaxAsDouble())
        putDouble("rangeTempMin", tempRange.getMinAsDouble())
        putDouble("rangeTempMax", tempRange.getMaxAsDouble())
        putDouble("rangeRrMin", rrRange.getMinAsDouble())
        putDouble("rangeRrMax", rrRange.getMaxAsDouble())
    }
    super.onSaveInstanceState(outState)
}
override fun onPostCreate(savedInstanceState: Bundle?) {
super.onPostCreate(savedInstanceState)
    updateIapData(savedInstanceState)
    updateUoData(savedInstanceState)
    updateTempData(savedInstanceState)
    updateRRData(savedInstanceState)
}

override fun onRestoreInstanceState(savedInstanceState: Bundle?) {
    super.onRestoreInstanceState(savedInstanceState)
     updateIapData(savedInstanceState)
    updateUoData(savedInstanceState)
    updateTempData(savedInstanceState)
    updateRRData(savedInstanceState)
}
private fun updateIapData(savedInstanceState: Bundle?) {
UpdateSuspender.using(iap_chart) {
var count = DEFAULT_POINT_COUNT
if (savedInstanceState != null) {
count = savedInstanceState.getInt(“count”)
            val rangeMin = savedInstanceState.getDouble("rangeIapMin")
            val rangeMax = savedInstanceState.getDouble("rangeIapMax")

            iap_chart.xAxes[0].visibleRange.setMinMaxDouble(rangeMin, rangeMax)
        }

        val iap = mutableListOf<Short>()
        val date = mutableListOf<Date>()
        for (entry in mSimplifiedDataList) {
            if (entry.emr.iap > 0) {
                iap.add(entry.emr.iap)
                date.add(Date(DateTimeUtils.toEpochMilli(entry.getRtcTimeStamp())))
            } else {
                iap.add(0)
                date.add(Date(DateTimeUtils.toEpochMilli(entry.getRtcTimeStamp())))
            }
        }
        tv_iap_input_data.text = iap[iap.size.minus(1)].toString()
        xyIapDataSeries.append(date, iap)
    }
}
……rest other for updating data over UI.
- Praween Kumar asked 5 years ago
- last active 5 years ago
I have a question about the scichart performance. I need to display a lot of data on the real time chart and above 2400000 values the chart crops and reacts very slowly. It was tested on Samsung s7. Does scichart handle that much data on devices? Is there any minimum phone performance requirements?
- al luk asked 6 years ago
- last active 6 years ago
Hello all,
I’ve a question about the android chart,
I’ve see WPF include fft plotting support, but I didn’t see it in android ?
can you tell me if the android scichart have it ?
thanks
- Davy Thibaut asked 8 years ago
- last active 8 years ago
Hi,
I want to change the colormap so that the:
– minimum (blue) = 4095
– maximum (red) = 800
Also, I want to set 0 to either black or transparent.
I can easily change the min and max values, just wanting to change the color limit and set 0 = black.
Here is my code for creating the heatmap:
public void heatmap(){
    // Create a SciChartSurface
    SciChartSurface surface = new SciChartSurface(this);
    // Get a layout declared in "activity_main.xml" by id
    LinearLayout chartLayout = findViewById(R.id.chart_layout);
    // Add the SciChartSurface to the layout
    chartLayout.addView(surface);
    // Initialize the SciChartBuilder
    SciChartBuilder.init(this);
    // Obtain the SciChartBuilder instance
    final SciChartBuilder sciChartBuilder = SciChartBuilder.instance();
    final NumericAxis xAxis = sciChartBuilder.newNumericAxis()
            .withGrowBy(0.1, 0.1)
            .build();
    final NumericAxis yAxis = sciChartBuilder.newNumericAxis()
            .withGrowBy(0.1, 0.1)
            .build();
    final FastUniformHeatmapRenderableSeries heatmapRenderableSeries = sciChartBuilder.newUniformHeatmap()
            .withMinimum(4095)
            .withMaximum(800)
            .withCellTextStyle(sciChartBuilder.newFont().withTextSize(8).withTextColor(ColorUtil.White).build())
            .withDrawTextInCell(true)
            .withDataSeries(createDataSeries())
            .build();
    final SciChartSurface chart = surface;
    Collections.addAll(chart.getXAxes(), xAxis);
    Collections.addAll(chart.getYAxes(), yAxis);
    Collections.addAll(chart.getRenderableSeries(), heatmapRenderableSeries);
    Collections.addAll(chart.getChartModifiers(), sciChartBuilder.newModifierGroupWithDefaultModifiers().build());
}
- Jazz Adams asked 3 years ago
- last active 3 years ago
Is it possible?
Or make box annotations fit screen height?
(even when zooming)
- Vadim Kirey asked 5 years ago
- last active 5 years ago
We are working on an android based ELD application. We are looking for a ELD graph. Is it possible to accomplish this using SCICHART?
- saiesh raut asked 2 years ago
- last active 5 months ago
How to scale axes with different scale factor using pinch zoom?
For example, scale x axis only or scale x axis greater then y axis.
- Dmitry Kozhin asked 7 years ago
- last active 3 months ago
Hi all,
Why the API’s for iOS, Android and WPF are not identically?
I have seen many samples on the forum, but to adapt it to a different platform is very hard.
A lot of classes are different for each platform.
- Is there any “comparison” for the different platforms?
- Is this planned to unify the API’s?
Regards
Urs
- Urs Geser asked 5 years ago
- last active 5 years ago
I noticed that there are two debugging perspectives in Eclipse that are set for Android development.
Why two?
What does DDMS perspective do that Debug perspective does not?
To clarify, I’m only interested in the diff comparison table, not the complete list of DDMS functions.
Session.StatusCallback cannot be resolved for type – Facebook API
Can’t debug via eclipse on the phone with Jelly Bean
What does the use of “.” Without an object in Android (or java)?
Launching TriggerIO Android ForgeInspector
Android Maven in Eclipse – creating an activity
I’m also curious to know why the people who developed DDMS didn’t add it to the Debug perspective, but chose to implement it as an independent perspective.
- Kirsten Hickman asked 3 years ago
When i go to zoom on my YAxis while a YAxis VisibleRangeLimit is baing set, the zoom does not work correctly. Once the zooming is finished it will reset back to the range limit. If i remove the range limit, the zooming then works as expected.
- Clifford Bateman asked 6 years ago
In Xamarin.IOS when you set the legend to Horizontal and Top it will create a legend at the top then allow you to scroll horizontally to see all your LineSeries. In Xamarin.Android when you have more Series than can originally fit on the screen, the legend malfunctions and takes up the entire screen. Picture will be attached.
- Clifford Bateman asked 6 years ago
- last active 6 years ago
I hope you can help me I have managed to change the font color, size, but I do not know how to put the annotation with underlined font, who could give me a clue please. I would like to get something like what is shown in the image I attached. Thanks in advance.
- Julio Olivos asked 7 years ago
- last active 7 years ago
I hope you can help me, please. Is it possible to remove the lines that protrude on the edge of the graphics, as shown in the image? If so, what would be the procedure?
Thank you very much in advance…
- Julio Olivos asked 7 years ago
- last active 7 years ago
Is it possible to put a background image on a chart? I hope you can give me a hint thanks in advance.
I attach an image for the purpose of my query.
- Julio Olivos asked 7 years ago
- last active 7 years ago
I have issue with legend on high resolutions screens. Checkboxes and text is very small and hard to read. I couldn’t find any solution to change text size or provide my own template with text size for legend in Android SciChart.
I want to change legend text size depends on screen like it is in Android by declaring size in dimens.xml.
I do that for Axis labels but I don’t know how do the same for text in legend.
Does anyone know how to achieve this?
- Marcin K asked 6 years ago
- last active 6 years ago
Hi,
I have issue with export SciChart to Bitamp. I have to generate pdf report from data. Report contains two charts.
It is possible to render chart in memory and export to bitmap? I know it is possible in WPF but I couldn’t achive this in Android.
Now my solution is that I render this charts on fragments and wait 1s on each to render and then save chart. But this solution is not good. For slower devices chart is not exported correctly.
For example on one device have strange grid (only exported bitmap, fragment with this chart looks good):

- Marcin K asked 6 years ago
- last active 6 years ago
Hi, I want to draw a chart like the attached image.
This is a chart with XyDataSeries, it show as vertical line at each data point and verticle line is a dotted line in order to separated from other series.
Since the OHLC chart will have the open, close on the data point and an impulse chart is forced to draw from an axis, is there any better way that can achieve a series like this? Thank you!
- may lym asked 4 years ago
- last active 4 years ago
I would like to format several lines differently while still scaling them all to the same YAxis. For example if one line needs to go out to 4 decimal places but then another does not need any decimal values at all i would like those formats to be represented in all of the tooltips with said formats.
- Clifford Bateman asked 5 years ago
