SciChart® the market leader in Fast WPF Charts, WPF 3D Charts, iOS Chart, Android Chart and JavaScript Chart Components
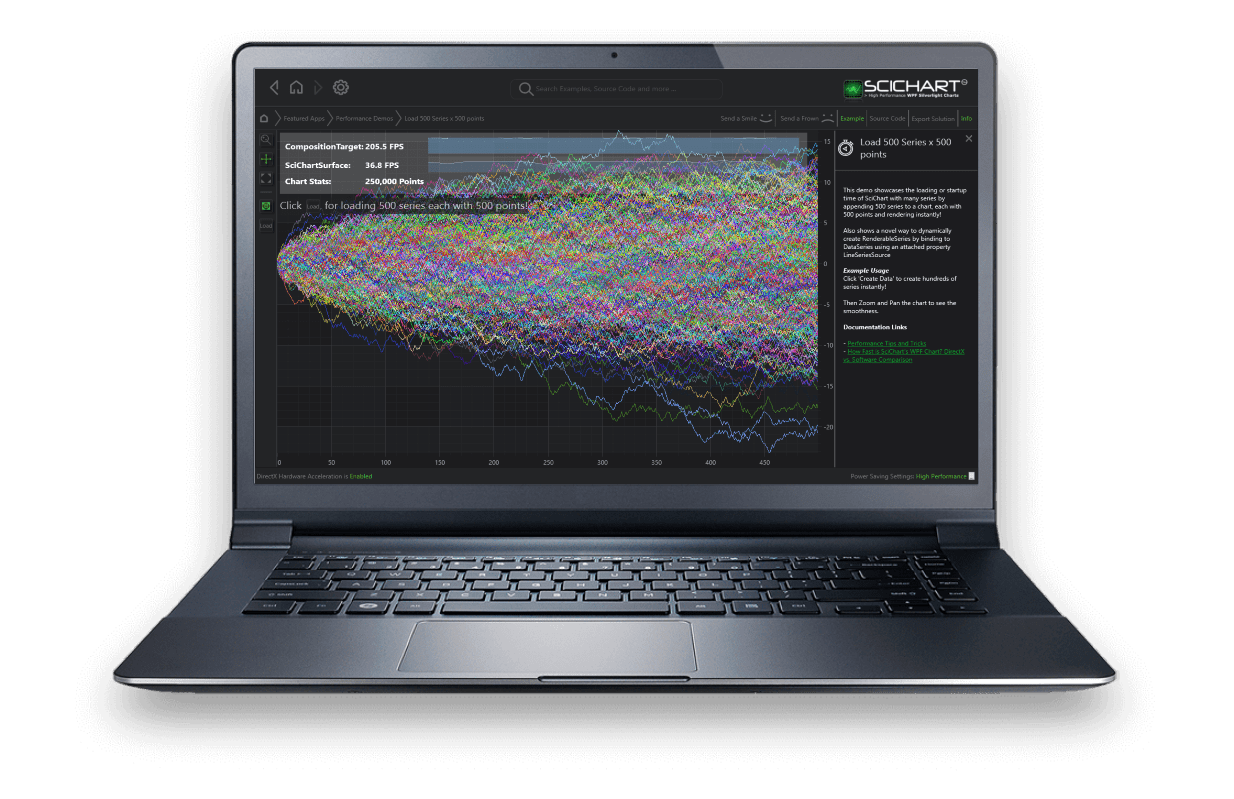
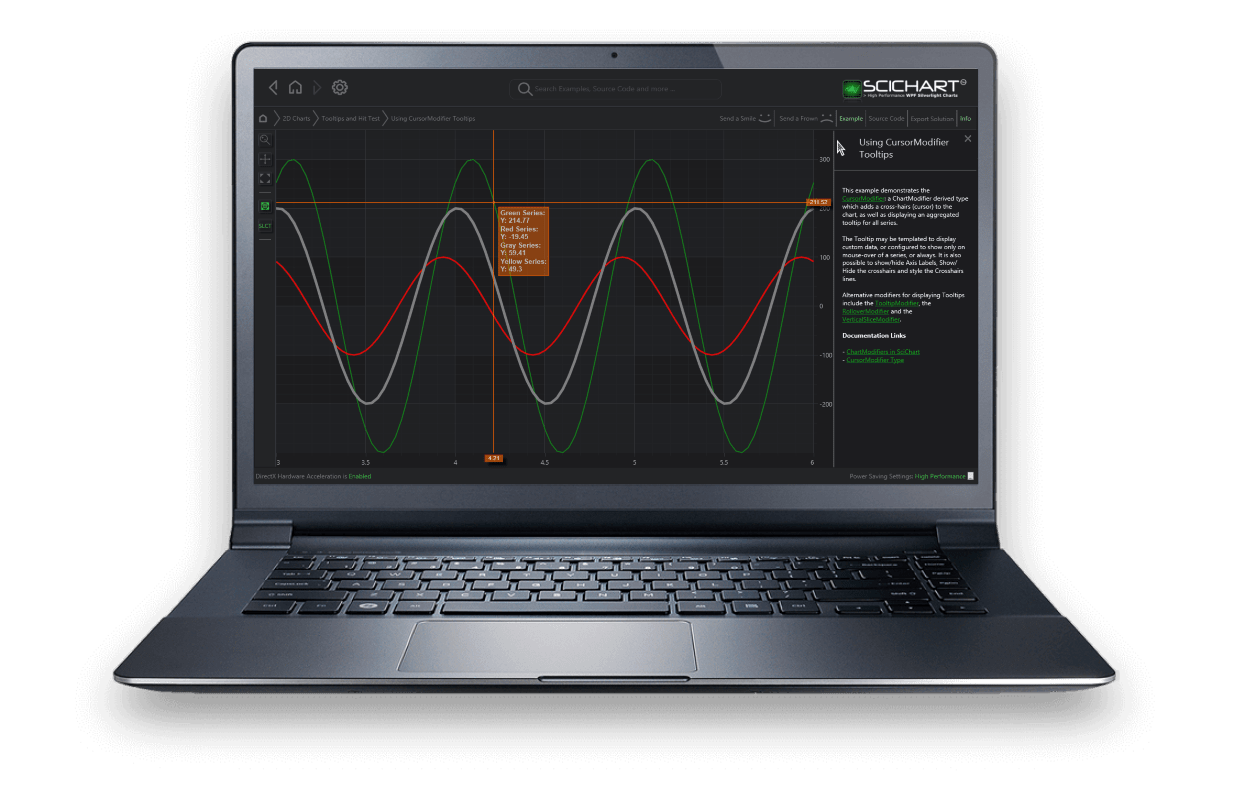
SciChart is a Realtime, High Performance .NET Charting Library, compatible with WPF and Windows Forms, made with Financial, Medical & Scientific Apps in mind. Perfect for Projects that Need Extreme Performance and Slick Interactive .NET Charts.
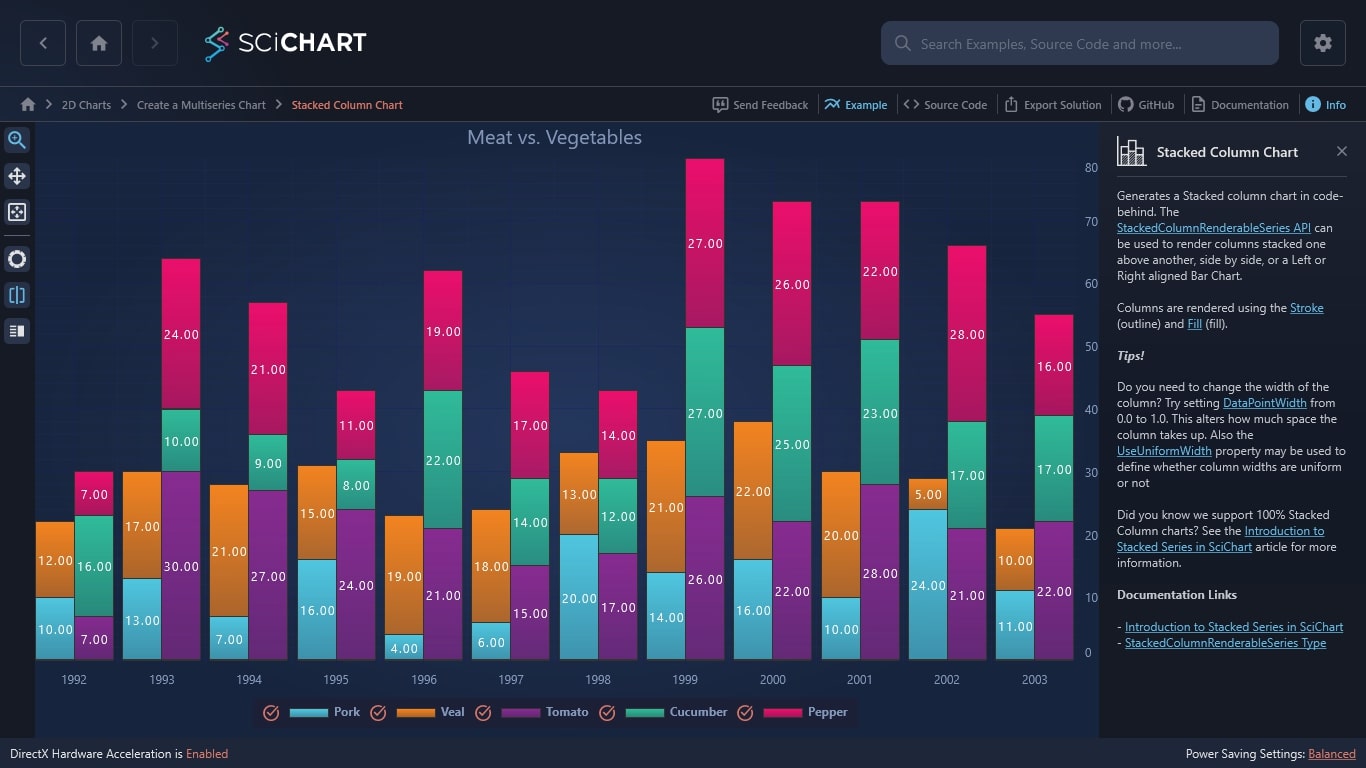
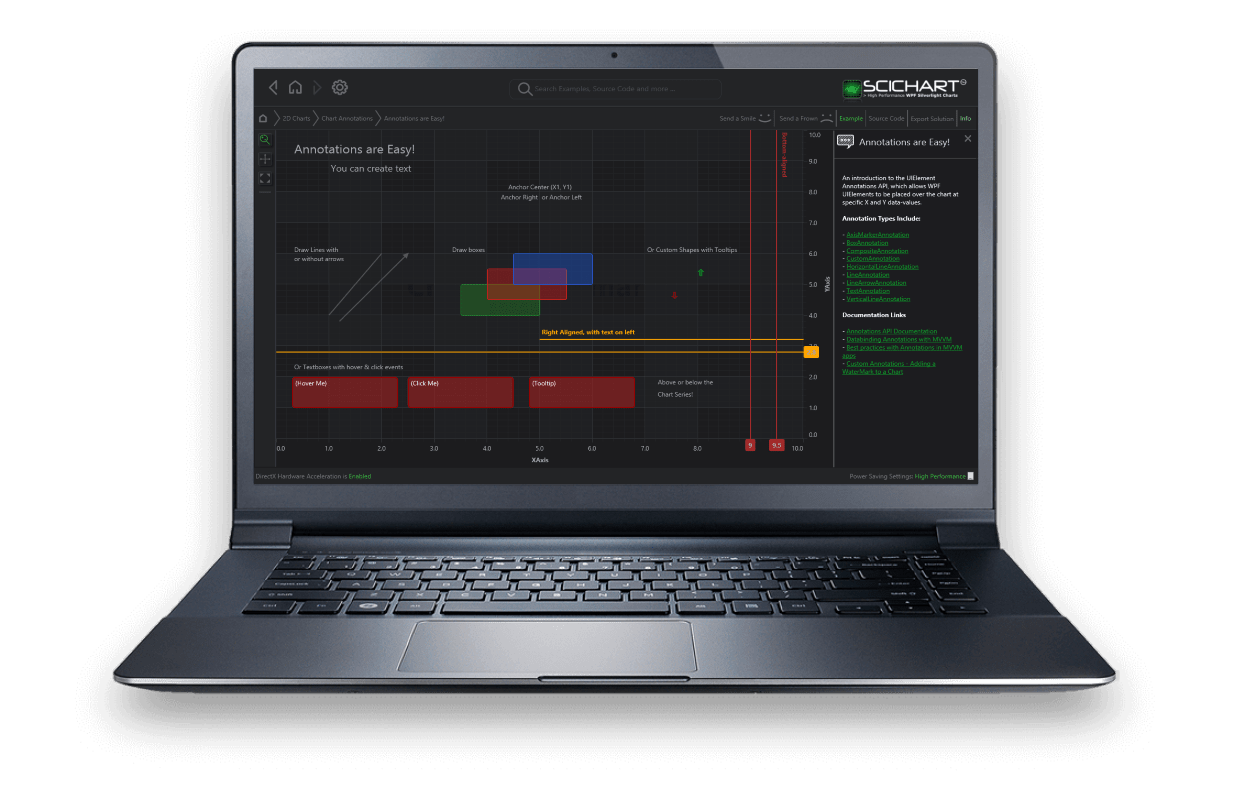
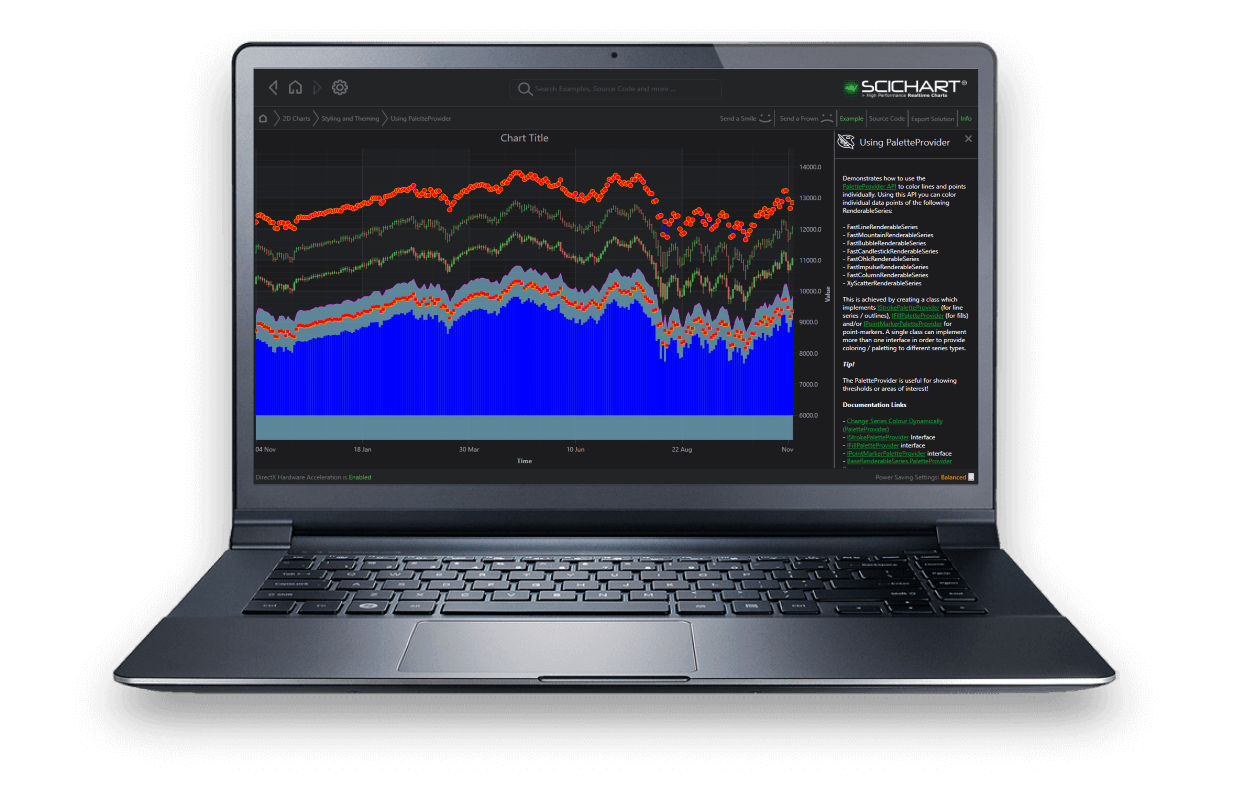
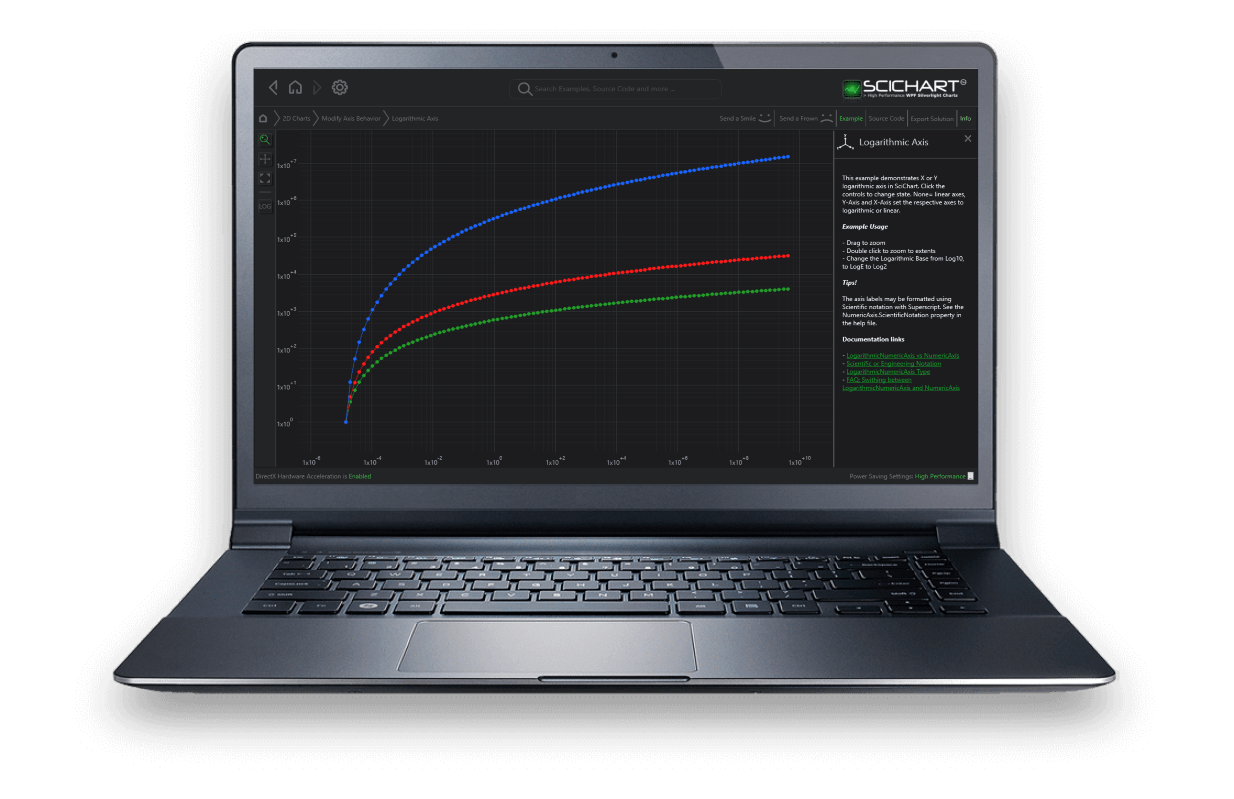
Get the Job Done with our ~50 2D & 3D .NET Chart Types and Extensive API.
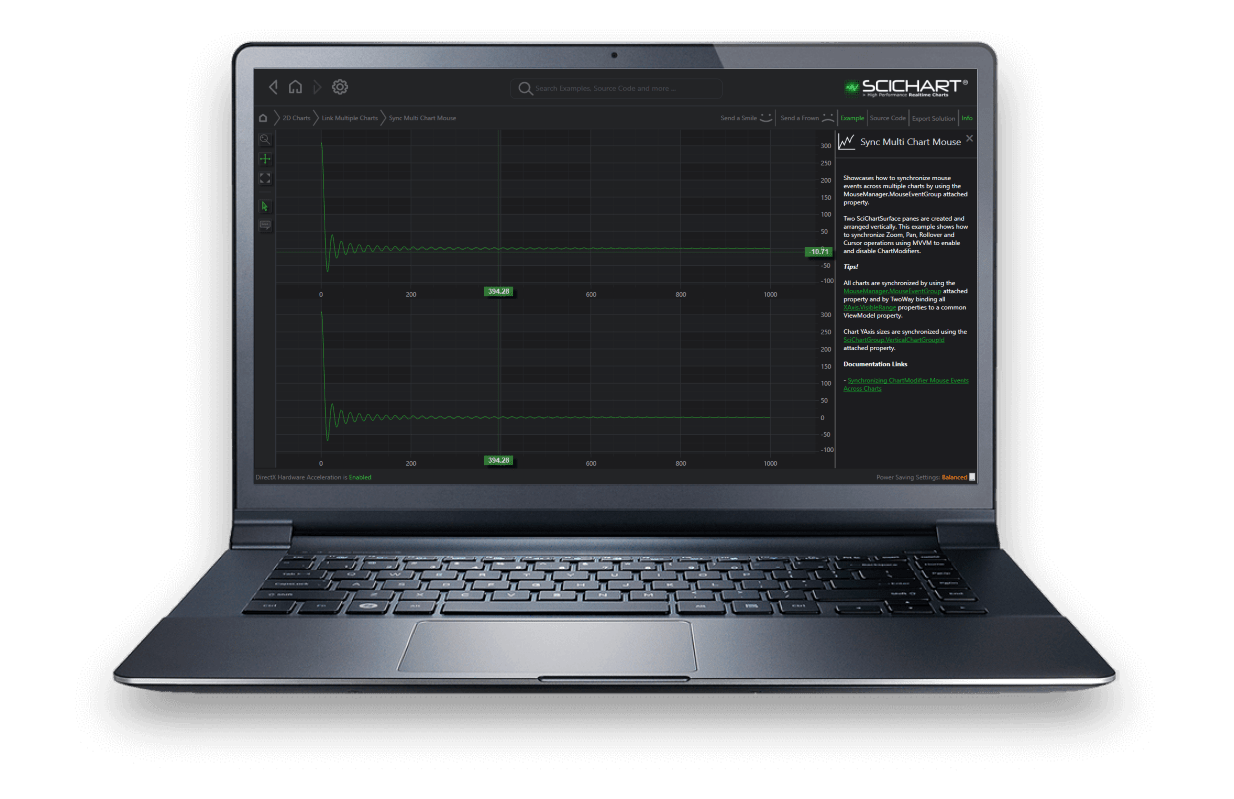
Featuring many popular .NET chart types, with blistering real-time performance, as well as the ability to create your own.
For the first time you can create Windows Forms and WPF .NET Applications which chart many millions of data-points, and still zoom, pan and update interactively!
Benefit from the ultimate efficiency of native-code and GPU-acceleration with our High Performance .NET Charting Library. Chart start-up time is instant and our low memory and CPU footprint will improve your overall application performance.
Make your projects possible with our high performance, realtime .NET charts.
SciChart features unlimited, multiple X and Y axis.
Our .NET charts support unlimited, multiple X, and Y Axis on the left, right, bottom and top of the chart. You can change Axis alignment, rotate charts, and mix axis (have both XAxis/YAxis on the left). The possibilities are literally endless!
You can mix different types of axis on the same chart and customize how your data is scaled.
SciChart's Chart Modifier API features rich cursors, tooltips and legends out of the box .
There are Rollovers, Cursors, Tooltips, Vertical slice modifier and Crosshairs ready out of the box. As well as Legends, that are easy to customize. Style all these all to fit your .NET application just right.
SciChart .NET features a rich Annotations API, that allows you to place UIElements over the chart, at specific data-point locations.
Many annotations types are ready out of the box: Line, Line with arrow, Text, Box, Vertical and horizontal lines, Markers, Fibonacci retracement, and Fibonacci Extension. Custom and composite annotations API allows you to take it beyond the usual annotations. All our annotations are optionally editable by the user.
SciChart is built for both mouse interaction and touch screen! Rich touch interaction allows you to drag a rectangle to animate-zoom, drag to pan, scroll via axis drag, mouse wheel to zoom, double-click to zoom extents.
Our powerful Custom Chart Modifier API allows you to develop custom mouse interactivity extensions. You can create custom zooming, panning or feedback behaviours.
SciChart PaletteProvider API allows using per-point coloring. By hooking into the PaletteProvider API you can return a data-point style or color based on the X,Y data-values.
Use this to color bars, columns, candlesticks, scatter-points or line segments that meet certain criteria, such as exceeding a threshold, or being a point of interest.
SciChart has 8 stunning themes to choose from. You can apply themes from the Theme manager to your .NET charts with a single line of code. Themes affect default cursor, zoom, axis, gridlines, background and series colors.
You may customize even further and create you own custom theme.
SciChart for .NET has lots API hooks, which allow you to customize, extend or otherwise bend the chart control to fit your needs. Developers love our flexible, and powerful API!
Features different axis types, allows full control over axis labels - you can change text formatting, as well as axis transform values into custom labels e.g. strings, prefix, suffic, scientific notation and more
Features the ability to change color on a point-by-point basis. E.g. if you want a mountain to be blue if over a certain value? Or a scatter point to be red based on data-value?
Allows drawing of completely custom series overriding just one method - Draw() for creation of your own RenderableSeries that are not built-in SciChart yet.
Allows creation of behaviour modifiers which can be attached to the chart. For instance, all zooming, panning operations, tooltips, legends and even selection of points or lines - all can be customized in SciChart with this rich, powerful API
SciChart features many axes types out of the box. Those include Numeric Axis, Logarithmic Numeric Axis, Date Axis (all of which are value axis).
In addition, SciChart features Category Date Axis which is frequently used in stock charts as it allows collapsing weekends or overnight gaps.
There is no restriction in SciChart on the number of charts in an application. All charts can be synchronized together, so that they zoom, pan or display tooltips in unison.
This is useful to create complex dashboards where the output from several sensors, data-feeds or database tables can be displayed one above another with a common time-axis.
SciChart centers on high-performance and big data rendering. With strong knowledge and experience in Financial and Trading domain we have created a product that is now used in Hedge Funds, Investment Banks, Proprietary Trading Firms and Commodity Trading firms around the world.
The Category Date axis allows collapsing weekend and overnight gaps in trading data.
SciChart .NET allows you to create complex, multi pane stock chart applications with indicator panels, and even drawing tools to place the trading annotations, like Fibonacci Extension, Pitchfork XABCD and more.
SciChart provides native, high performance chart controls on four platforms: Android (Java, Kotlin), iOS (Objective-C, Swift), Xamarin (C#), and .NET (WPF and Windows Forms C#). For the best realtime charting component with cross platform support, choose SciChart.
One of SciChart’s main selling points is our tech support. We operate a support-desk for paid customers of SciChart who purchase priority support. We aim to answer requests within one business day. You will be able to speak to the developers who made SciChart and get back to work quickly with our outstanding technical support.
Have a read below of what some of our customers say:
SciChart’s .NET Charts are licensed on a perpetual, per-developer licensing model, with royalty free redistribution. You get access to the world’s best .NET Charts, starting from just $629 per developer license (without tech support), or $1099 USD with 1-years tech support and updates.